Fig. 5
Download original image
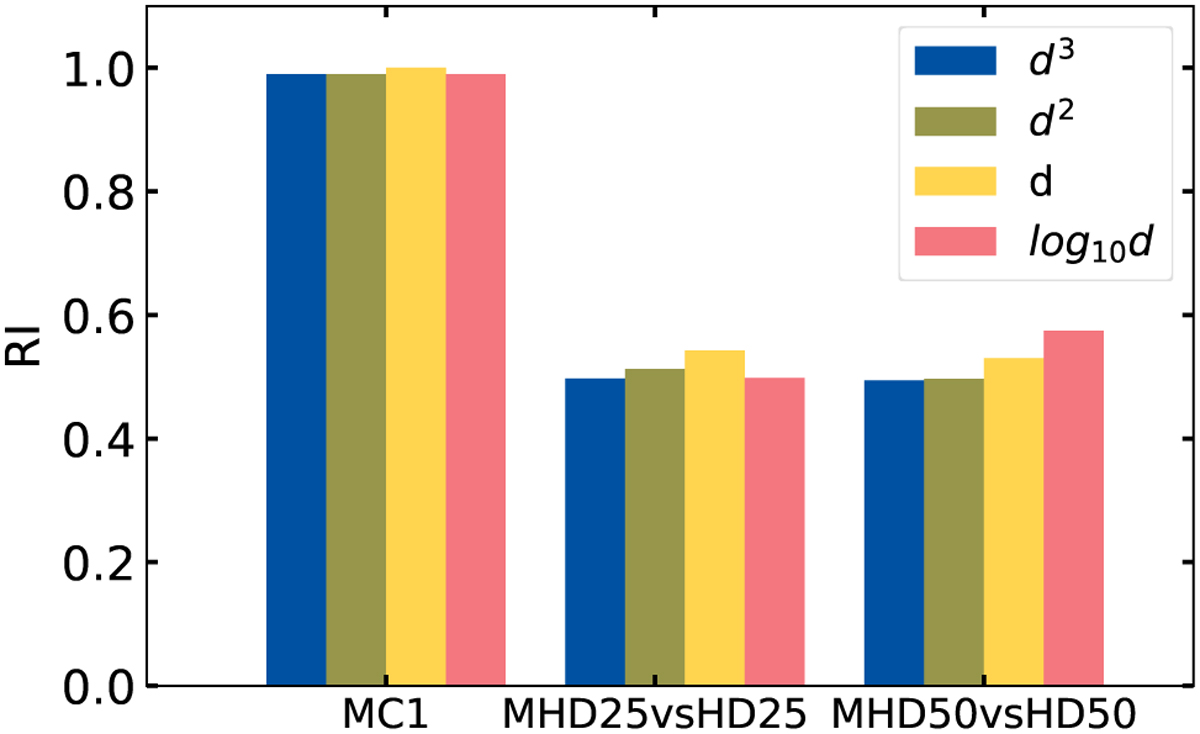
Rand index value on the y-axis for different datasets on the x-axis: all data try to define two clusters (‘MC1’, first column), ‘MHD25’ vs. ‘HD25’ (second column), and ‘MHD50’ vs. ‘HD50’ (third column). The colours show the different data transformations: polynomial with blue and green, standard with yellow, and logarithm with red (see the legend for details). The higher the Rand index, the more effective the clustering. The best results were obtained with standard and polynomial data for the first column (all data, distance difference).
Current usage metrics show cumulative count of Article Views (full-text article views including HTML views, PDF and ePub downloads, according to the available data) and Abstracts Views on Vision4Press platform.
Data correspond to usage on the plateform after 2015. The current usage metrics is available 48-96 hours after online publication and is updated daily on week days.
Initial download of the metrics may take a while.