Fig. 2
Download original image
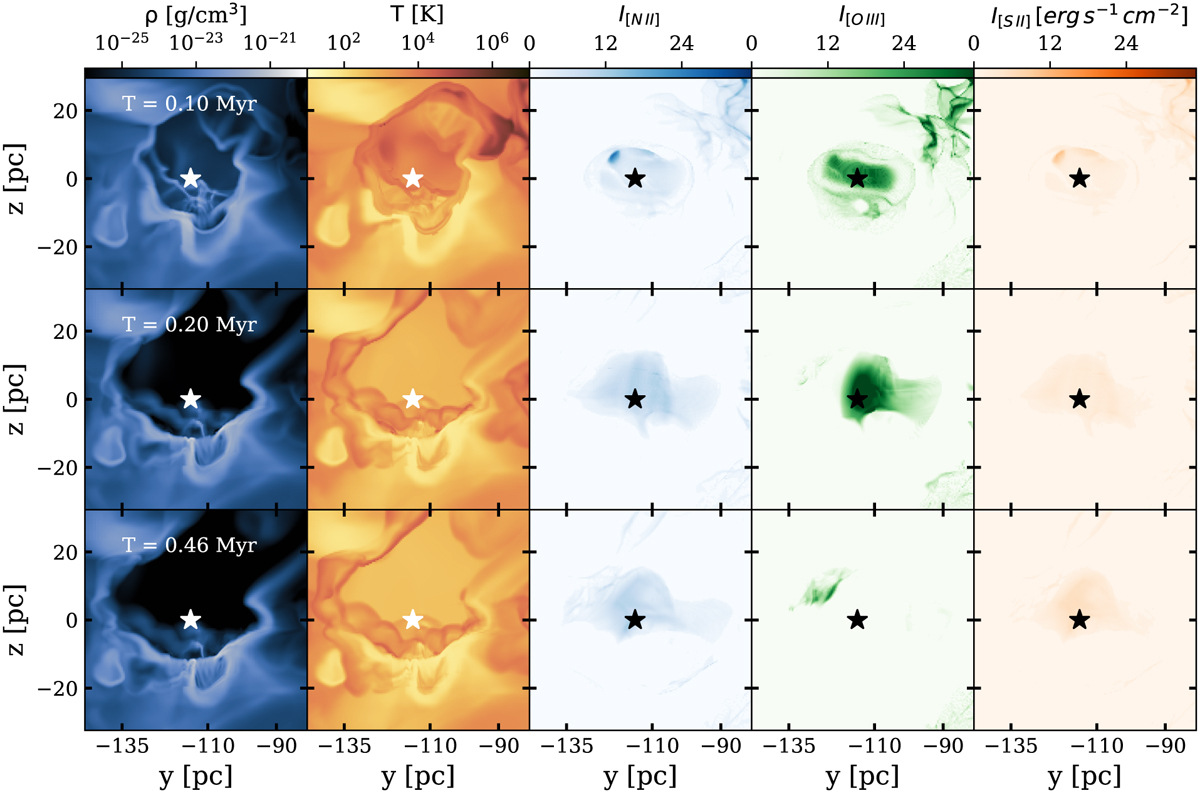
Time evolution (from top to bottom) of (from left to right): density slice, temperature slice, [N II] (λ 6583 Å) intensity projection, [O III] (λ 5007 Å) intensity projection, and [S II] (λ 6731 Å) intensity projections for the ‘MHD50+X’ simulation. The star symbol in each panel represents the position of the SN explosion. The SN explosion disrupts part of the dense MC, as can be seen from the density slice (first column). This MC and SN interaction gives rise to the optical emission from the SNR. From the temperature evolution of the SNR bubble (second column), we can see the hot gas (106–7 K) cooling down over 0.46 Myr, and forming the complex structures at the edge of the SNR and MC that are subsequently visible in the optical emission. Among three optical lines (third to fifth columns), the [O III] is the strongest as it is a ‘volume-filling emission’. [N II] and [S II] originate from a thin cooling layer right behind the shock front.
Current usage metrics show cumulative count of Article Views (full-text article views including HTML views, PDF and ePub downloads, according to the available data) and Abstracts Views on Vision4Press platform.
Data correspond to usage on the plateform after 2015. The current usage metrics is available 48-96 hours after online publication and is updated daily on week days.
Initial download of the metrics may take a while.