Fig. A.1
Download original image
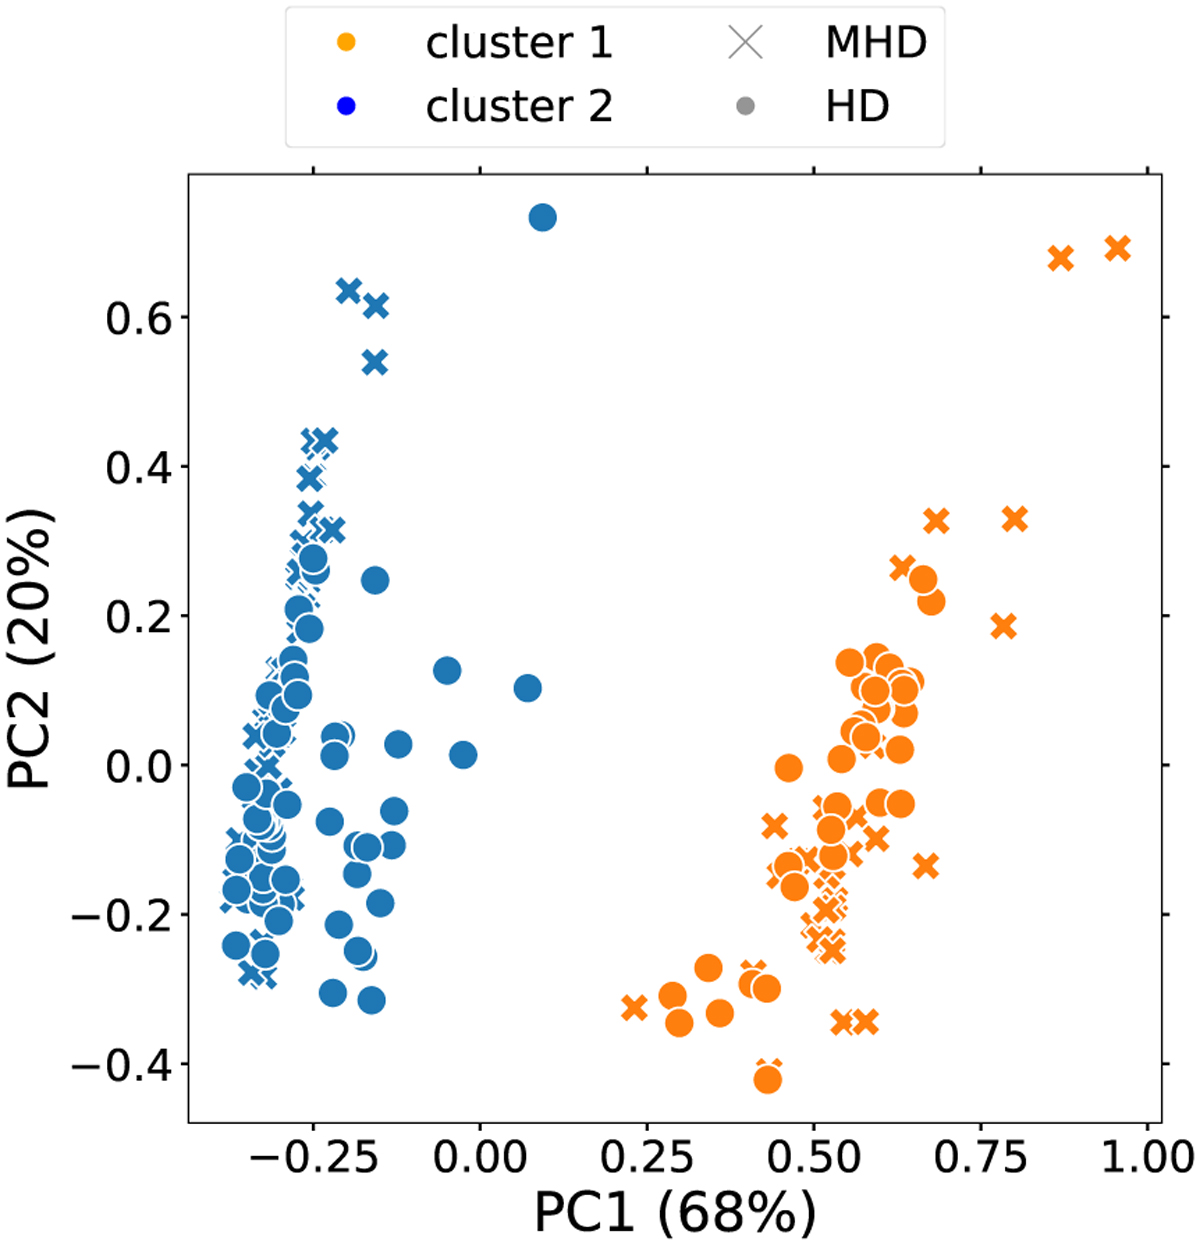
’MHD25’, ’MHD50’, ’HD25’, ’HD50’ datasets (e.g. ’MC1att’) after using the PCA algorithm. ’MHD’ simulations are marked with crosses, and ’HD’ simulations with circles. The predicted clusters are marked with blue and orange. The higher the percentage for each PC the higher the relative variance in the dataset that is observed in the direction of the corresponding eigenvector (for the absolute values see Table 3). We use nclust = 2 in the k-means algorithm. The data is clearly separated into two distinct clusters by distance: 25 pc and 50 pc (see Fig. 3), while MHD and HD labels are mixed.
Current usage metrics show cumulative count of Article Views (full-text article views including HTML views, PDF and ePub downloads, according to the available data) and Abstracts Views on Vision4Press platform.
Data correspond to usage on the plateform after 2015. The current usage metrics is available 48-96 hours after online publication and is updated daily on week days.
Initial download of the metrics may take a while.