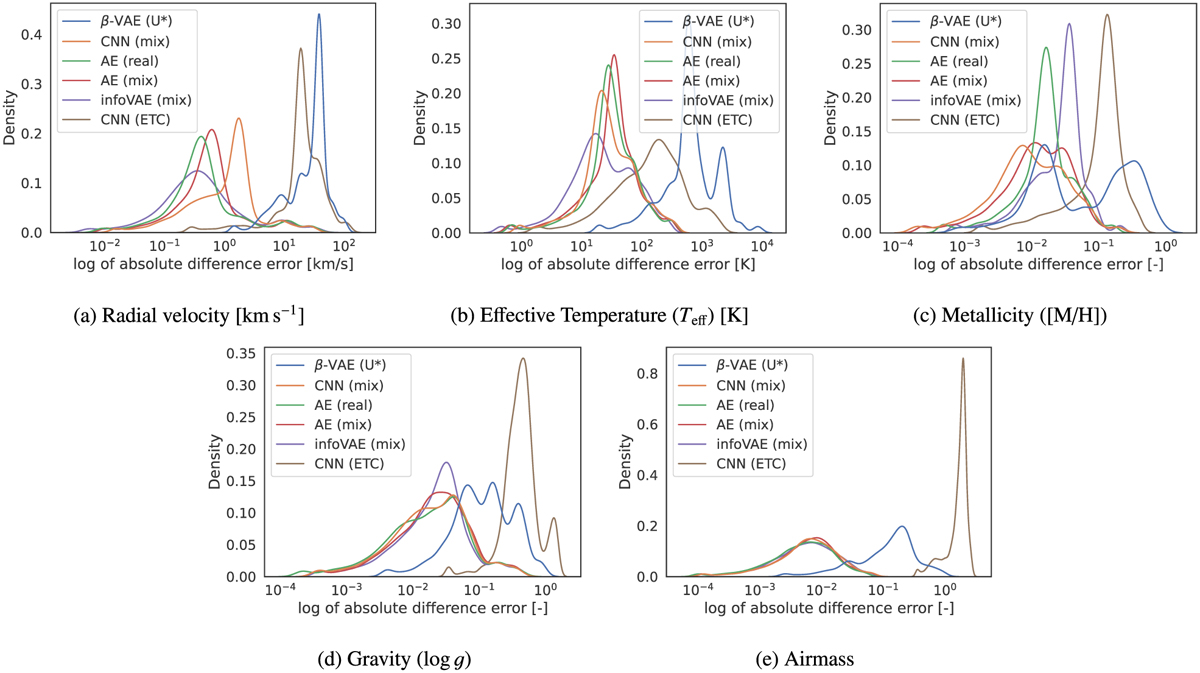
Fig. 2
Download original image
Kernel density estimation plots illustrating the distribution of absolute error differences. The KDE bandwidth is determined by Scott’s rule and is clipped between the first and 99th percentiles. The models are supervised encoders (real and mixed data), supervised AE (bottleneck = 9), supervised infoVAE (bottleneck=32), and VAE (bottleneck = 128) (Sedaghat et al. 2021).
Current usage metrics show cumulative count of Article Views (full-text article views including HTML views, PDF and ePub downloads, according to the available data) and Abstracts Views on Vision4Press platform.
Data correspond to usage on the plateform after 2015. The current usage metrics is available 48-96 hours after online publication and is updated daily on week days.
Initial download of the metrics may take a while.