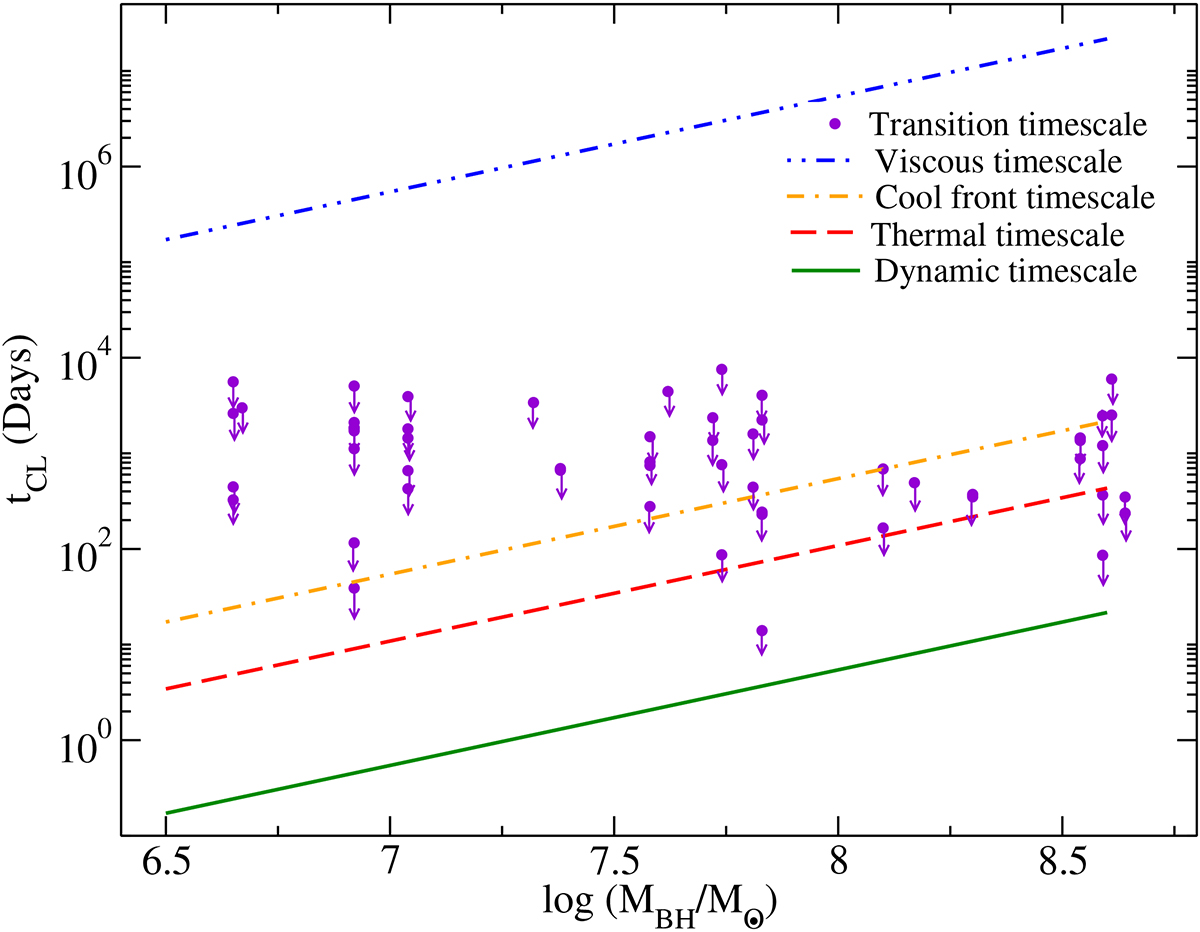
Fig. 9.
Download original image
Relation of the transition timescale (tCL) with the black hole mass in logarithmic scale (log MBH). The downward pointing purple arrows represent the upper limit of the transition time for all CL transitions in our study. The dashed-dot-dot-dashed blue, dot-dashed orange, dashed red, and solid green lines represent the viscous time, cold front propagation time, thermal time, and dynamic time, respectively. The timescales are calculated assuming a disk aspect ratio H/R = 0.2 and a viscosity parameter α = 0.1.
Current usage metrics show cumulative count of Article Views (full-text article views including HTML views, PDF and ePub downloads, according to the available data) and Abstracts Views on Vision4Press platform.
Data correspond to usage on the plateform after 2015. The current usage metrics is available 48-96 hours after online publication and is updated daily on week days.
Initial download of the metrics may take a while.