Open Access
Fig. 2.
Download original image
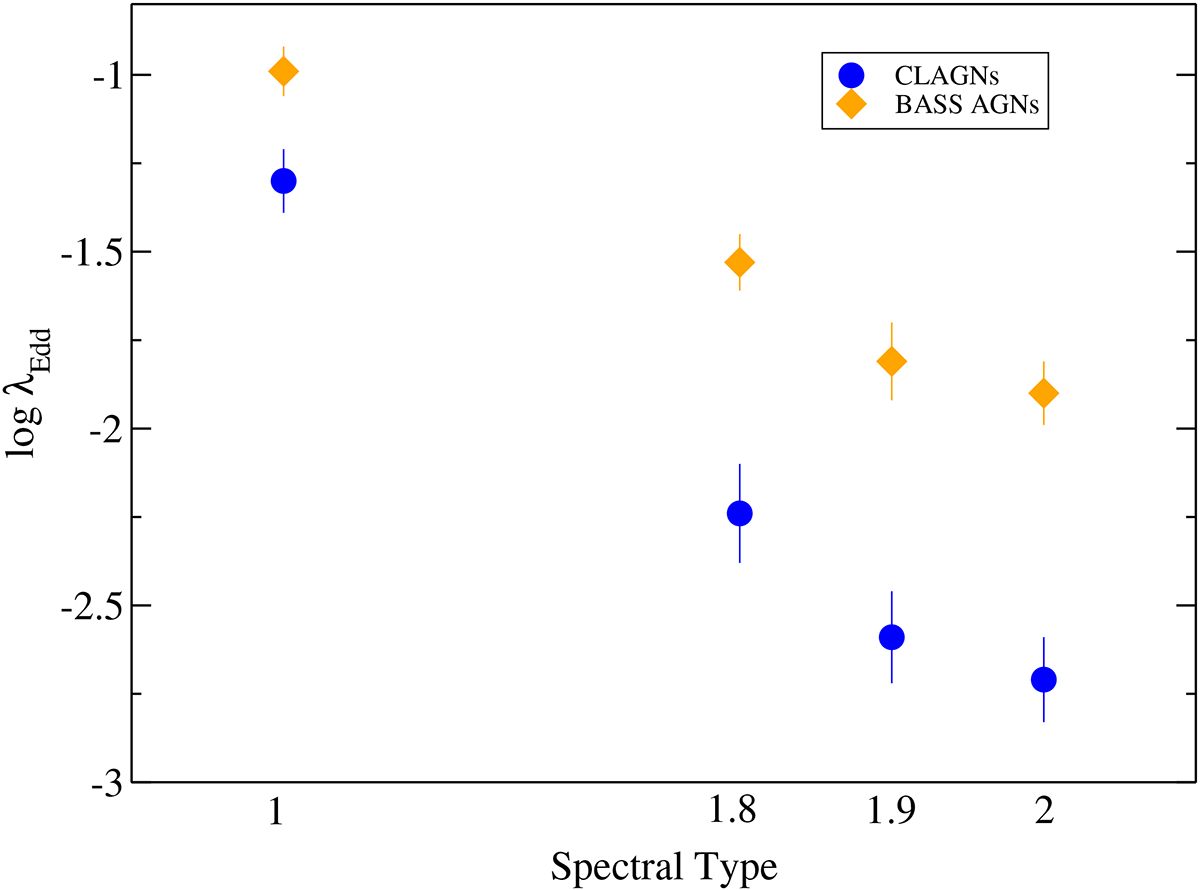
Median Eddington ratio in each spectral state. The blue circles represent the median λEdd for CLAGNs. The orange diamonds represent the median λEdd for the other AGNs from the BASS sample for which CL transitions were not detected.
Current usage metrics show cumulative count of Article Views (full-text article views including HTML views, PDF and ePub downloads, according to the available data) and Abstracts Views on Vision4Press platform.
Data correspond to usage on the plateform after 2015. The current usage metrics is available 48-96 hours after online publication and is updated daily on week days.
Initial download of the metrics may take a while.