Open Access
Fig. 6
Download original image
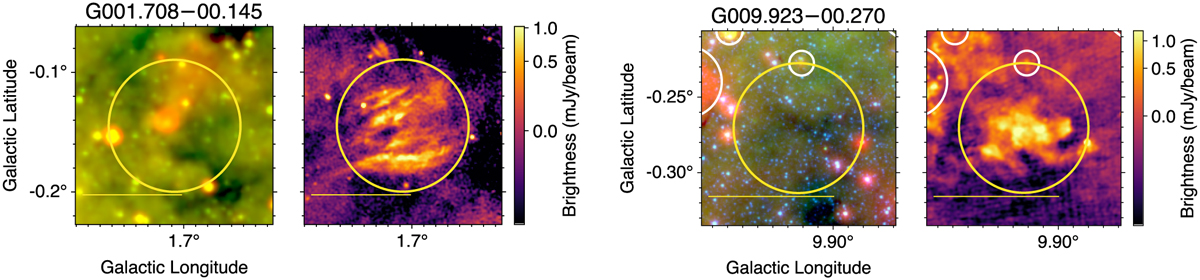
Example unusual sources of SMGPS emission. MIR data are in the left panels (Spitzer or WISE) and SMGPS 1.3 GHz data in the right. The symbols have the same meaning as in Fig. 1, with the unusual sources represented by yellow circles at the centers of all panels. Yellow scale bars at the lower left of each panel are 5′ long.
Current usage metrics show cumulative count of Article Views (full-text article views including HTML views, PDF and ePub downloads, according to the available data) and Abstracts Views on Vision4Press platform.
Data correspond to usage on the plateform after 2015. The current usage metrics is available 48-96 hours after online publication and is updated daily on week days.
Initial download of the metrics may take a while.