Fig. 5
Download original image
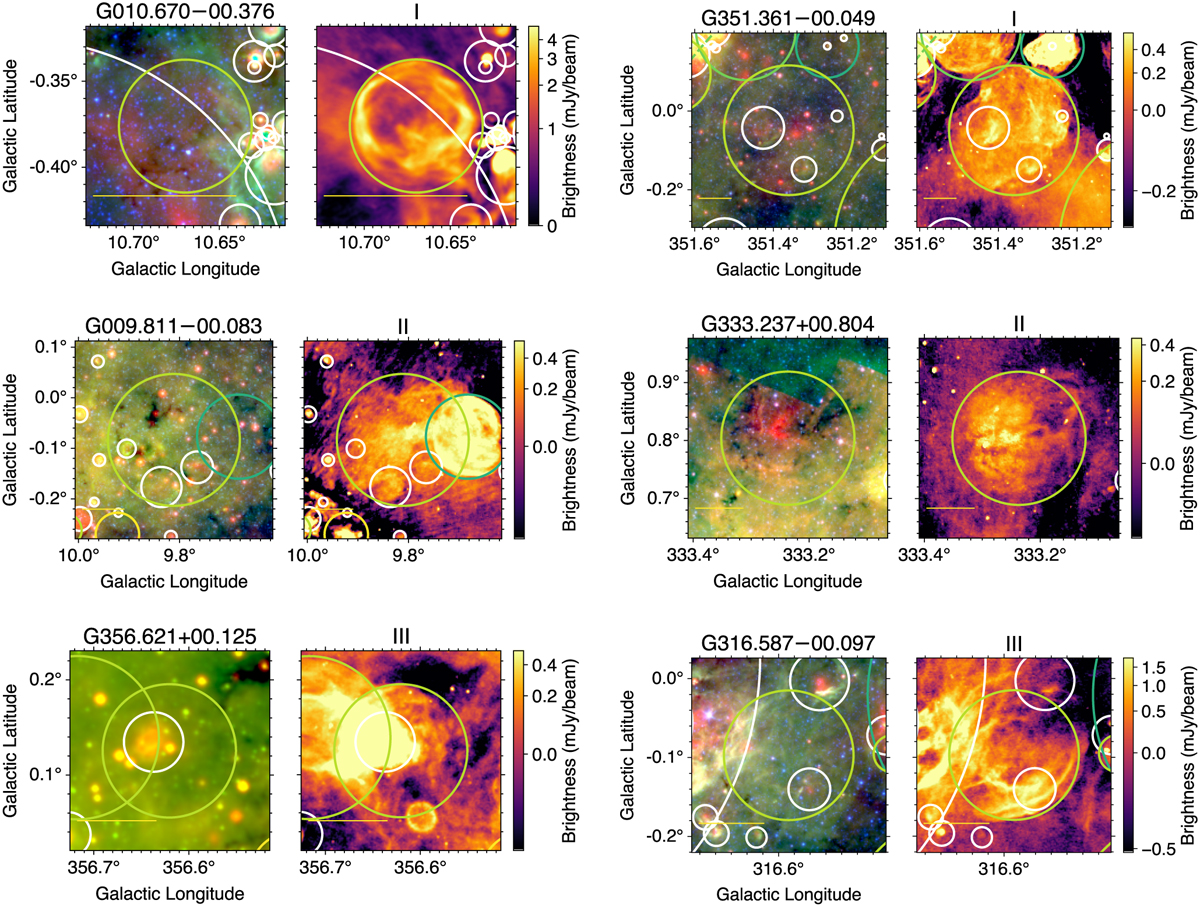
Example newly discovered SNR candidates. MIR data are shown in the left panels and SMGPS 1.3 GHz data in the right. The symbols have the same meaning as in Fig. 1, with the candidate SNRs represented by light green circles at the centers of all panels. On the top of the panels showing SMGPS images we list our reliability classification, with I being the most reliable and III the least. Yellow scale bars at the lower left of each panel are 5′ long.
Current usage metrics show cumulative count of Article Views (full-text article views including HTML views, PDF and ePub downloads, according to the available data) and Abstracts Views on Vision4Press platform.
Data correspond to usage on the plateform after 2015. The current usage metrics is available 48-96 hours after online publication and is updated daily on week days.
Initial download of the metrics may take a while.