Fig. 1
Download original image
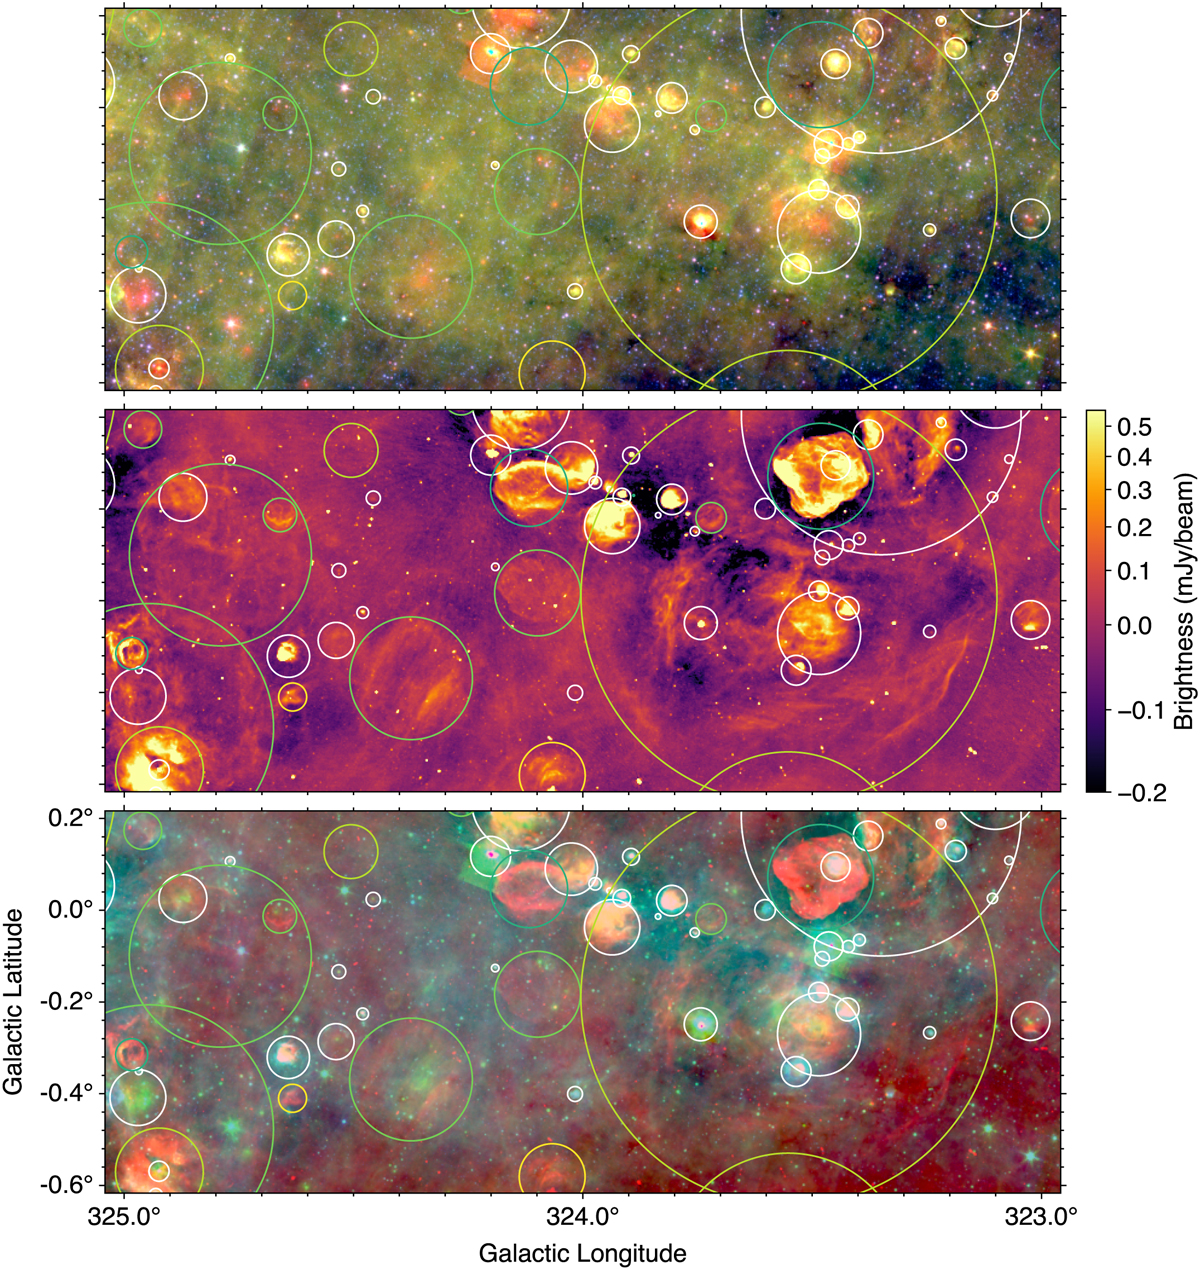
Example field centered at (ℓ, b) = (324.0°, −0.2°). Top: Spitzer three-color data, with MIPSGAL 24 µm data in red, GLIMPSE 8.0 µm data in green, and GLIMPSE 3.6 µm data in blue. Middle: 1.3 GHz SMGPS data. Bottom: 1.3 GHz SMGPS data in red, MIPSGAL 24 µm data in green, and GLIMPSE 8.0 µm data in blue. White circles show HII regions from the WISE Catalog (Sect. 2.3), blue-green circles previously known SNRs (Sect. 4.1), green circles previously known SNR candidates (Sect. 4.2), light green circles SNR candidates newly identified here (Sect. 4.3), and yellow circles “unusual” sources (Sect. 4.4). Although there are no examples in this field, in subsequent figures we show misidentified or undetected SNRs and SNR candidates with dashed circles.
Current usage metrics show cumulative count of Article Views (full-text article views including HTML views, PDF and ePub downloads, according to the available data) and Abstracts Views on Vision4Press platform.
Data correspond to usage on the plateform after 2015. The current usage metrics is available 48-96 hours after online publication and is updated daily on week days.
Initial download of the metrics may take a while.