Fig. 9.
Download original image
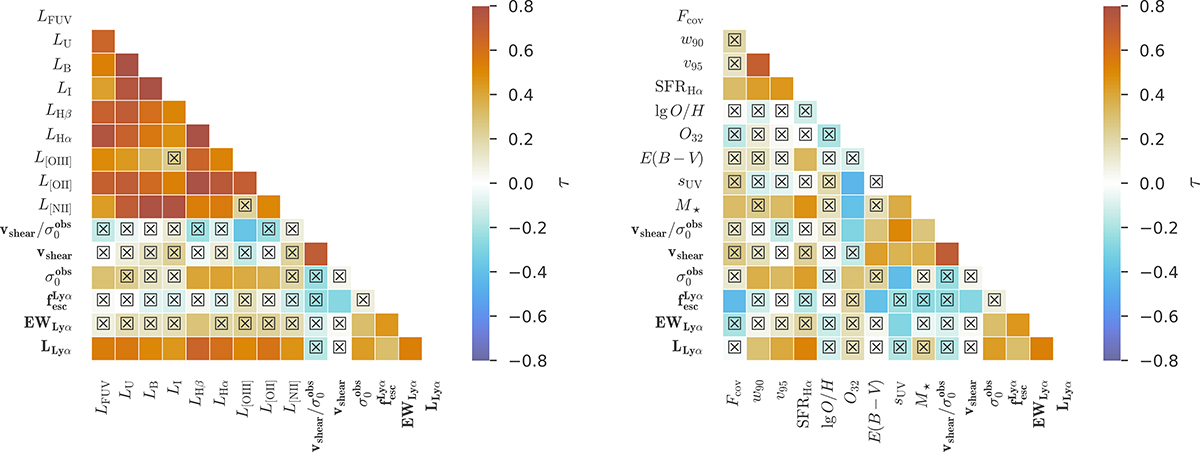
Correlation matrix heat map visualisation (Kendall’s τ) for observational parameters (left panel) and physical parameters (right panel), including vshear, ![]() , and vshear/σ0obs, as well as the Lyα observables
, and vshear/σ0obs, as well as the Lyα observables ![]() , EWLyα, and LLyα. Statistically insignificant trends (i.e. where p0 > 0.05, or correspondingly |τ|> 0.239 for N = 33) are crossed out.
, EWLyα, and LLyα. Statistically insignificant trends (i.e. where p0 > 0.05, or correspondingly |τ|> 0.239 for N = 33) are crossed out.
Current usage metrics show cumulative count of Article Views (full-text article views including HTML views, PDF and ePub downloads, according to the available data) and Abstracts Views on Vision4Press platform.
Data correspond to usage on the plateform after 2015. The current usage metrics is available 48-96 hours after online publication and is updated daily on week days.
Initial download of the metrics may take a while.