Fig. 7.
Download original image
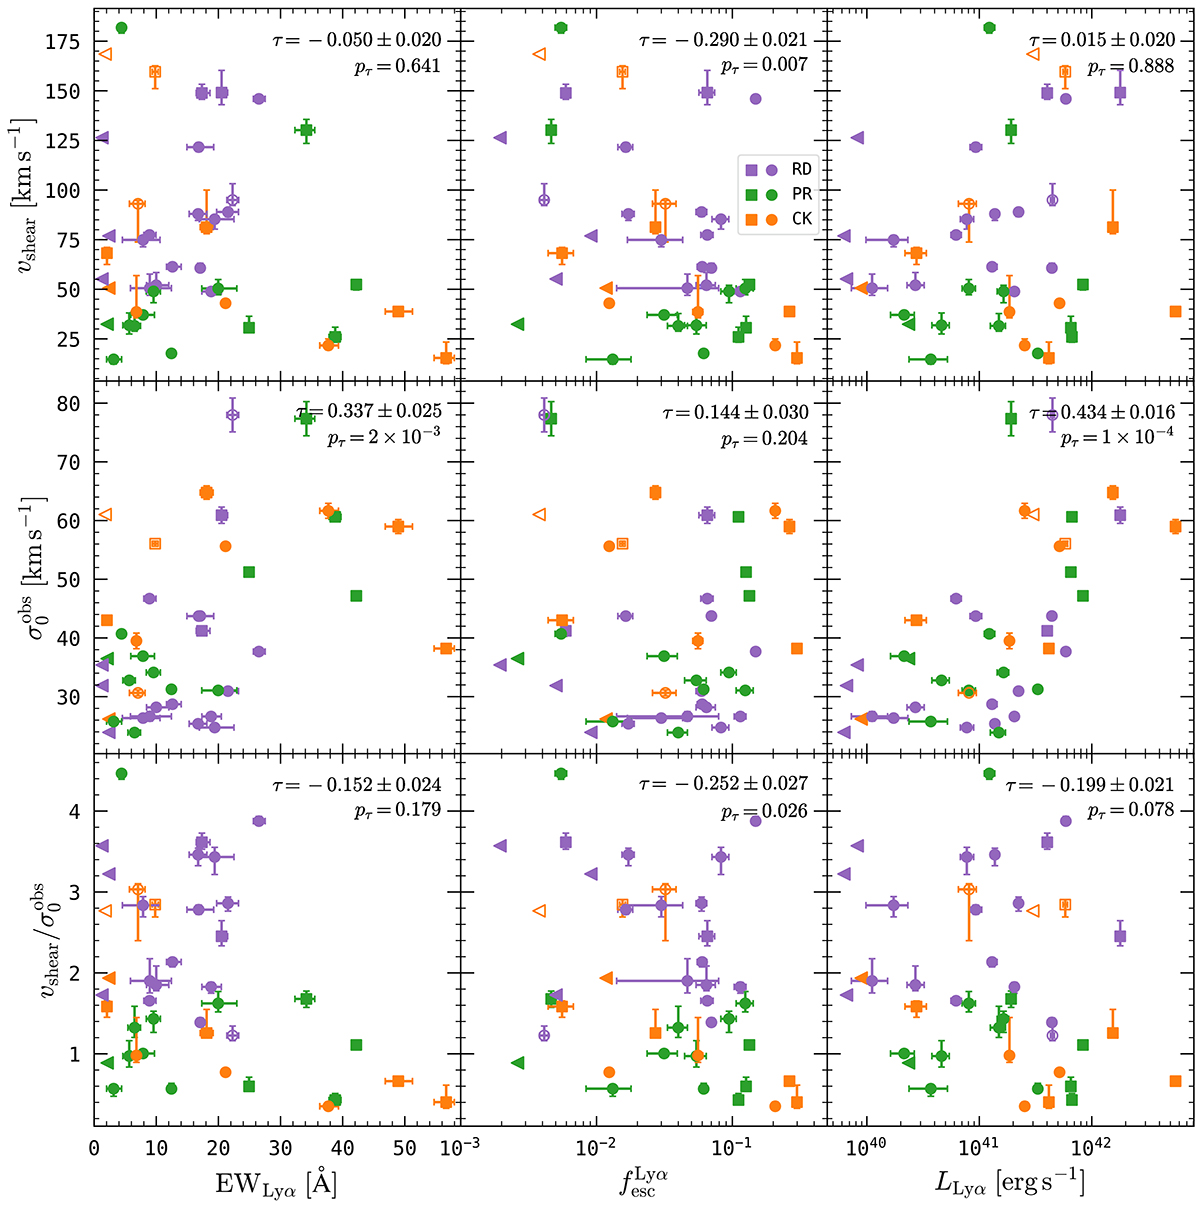
Relations between ionised gas kinematics (vshear, ![]() , vshear/σ0obs in the top-, middle-, and bottom row, respectively) and Lyα observables (EWLyα,
, vshear/σ0obs in the top-, middle-, and bottom row, respectively) and Lyα observables (EWLyα, ![]() , and LLyα, in the left-, centre-, and right column, respectively). Symbols are the same as in Fig. 6; additionally here upper limits in the Lyα observables are shown as leftward-pointing triangles. Correlation coefficients (Kendall’s τ) and corresponding p-values are provided in the top-right corner of each panel.
, and LLyα, in the left-, centre-, and right column, respectively). Symbols are the same as in Fig. 6; additionally here upper limits in the Lyα observables are shown as leftward-pointing triangles. Correlation coefficients (Kendall’s τ) and corresponding p-values are provided in the top-right corner of each panel.
Current usage metrics show cumulative count of Article Views (full-text article views including HTML views, PDF and ePub downloads, according to the available data) and Abstracts Views on Vision4Press platform.
Data correspond to usage on the plateform after 2015. The current usage metrics is available 48-96 hours after online publication and is updated daily on week days.
Initial download of the metrics may take a while.