Fig. 4.
Download original image
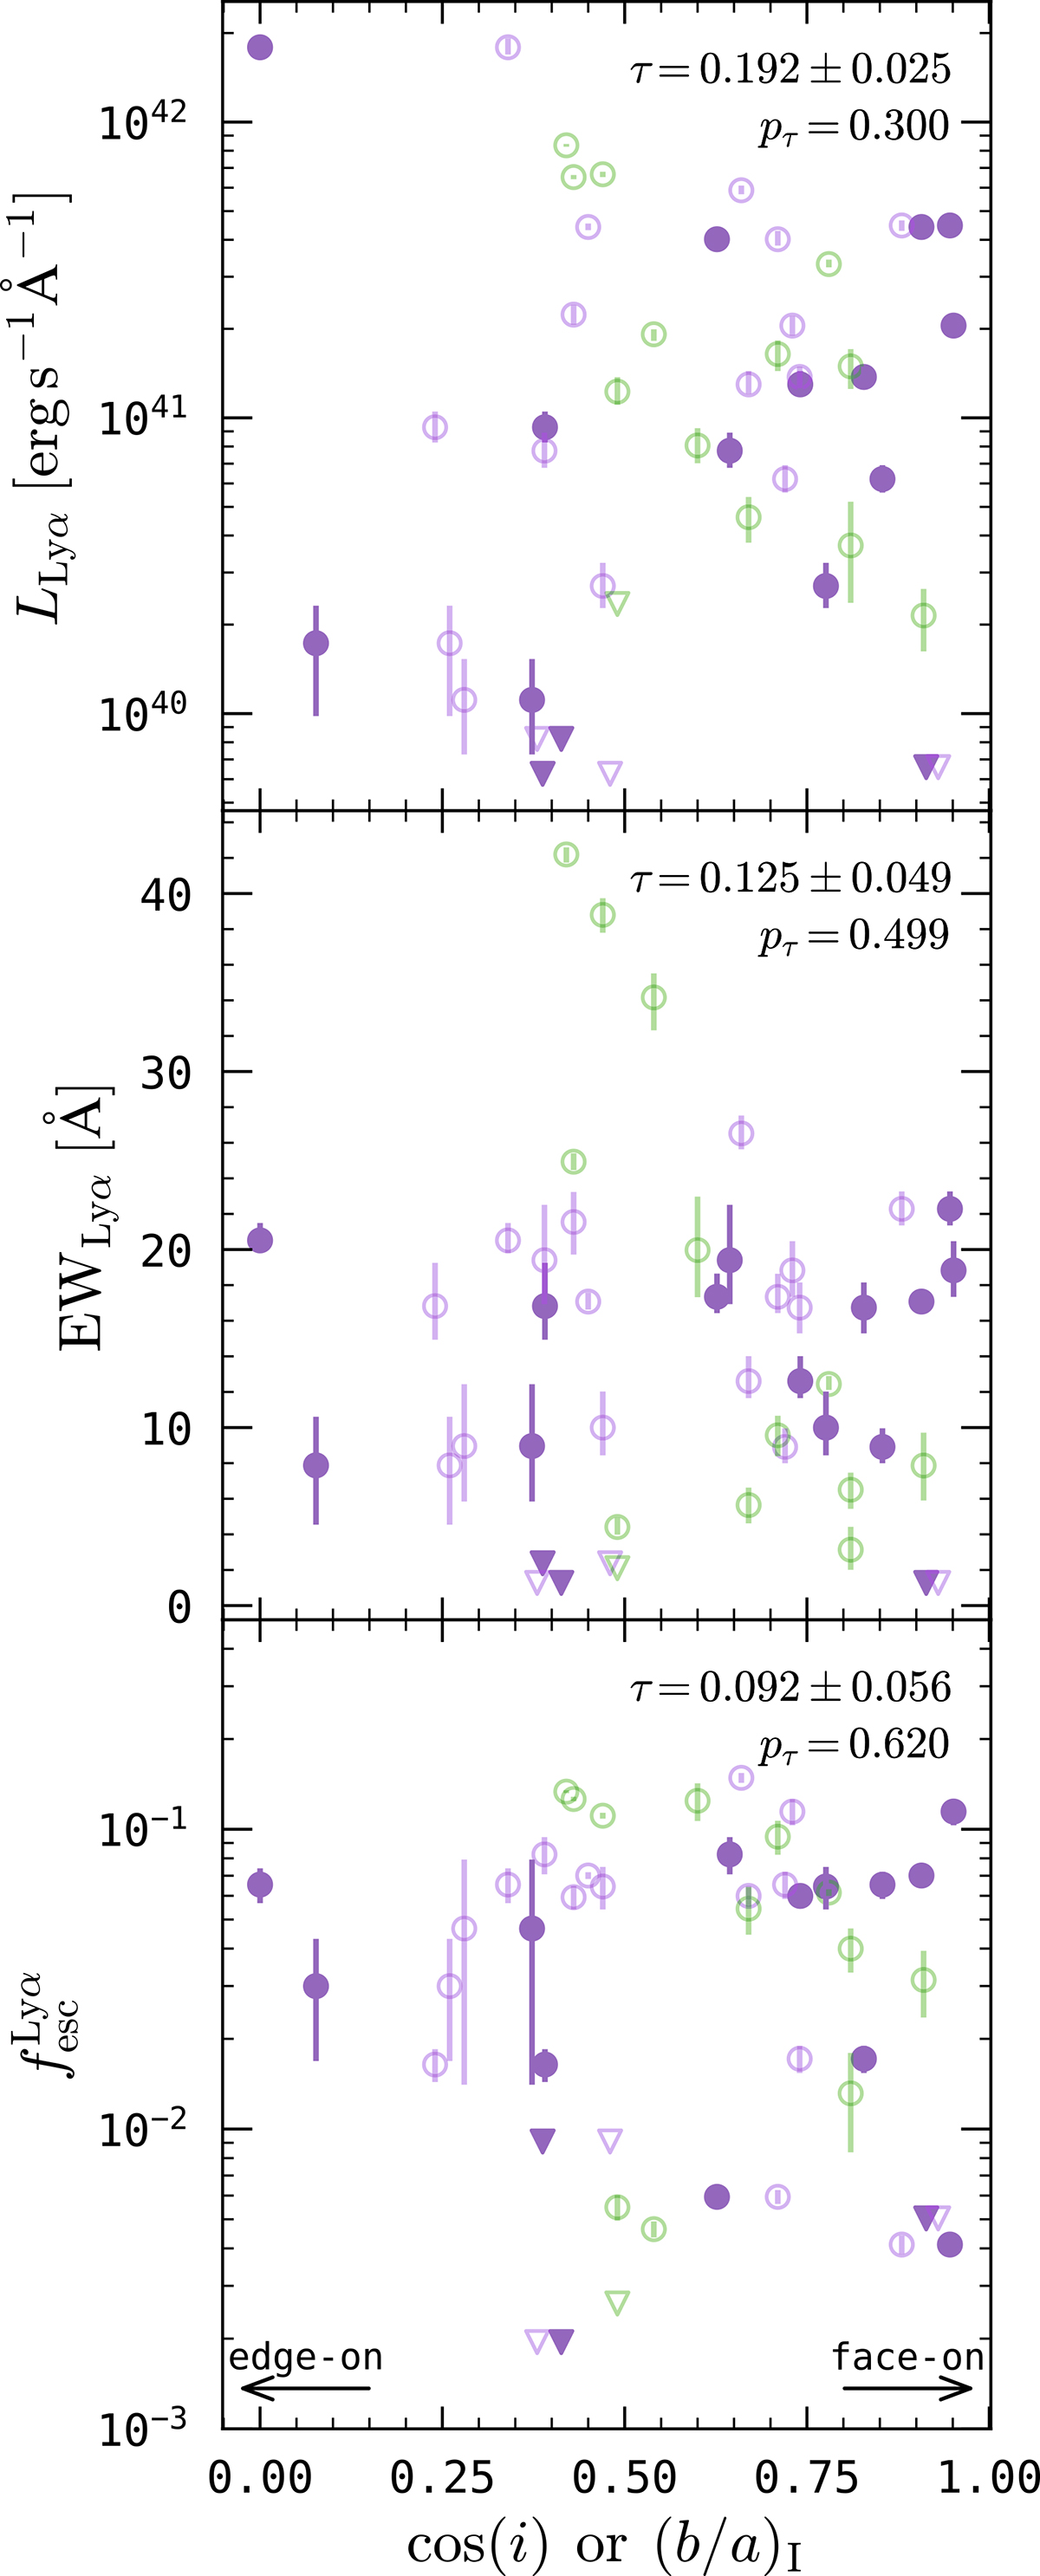
Lyα observables (top panel: LLyα; middle panel: EWLyα; bottom panel: ![]() ) vs. galaxy inclination. Filled purple symbols are based on the kinematical inclination, i, from the disc modelling of the RDs with GalPak3D. Unfilled symbols are based on photometric inclinations (purple: RD; green: PR) according to cos(i)≈(b/a)I, where (b/a)I is the I-band axis ratio from Rasekh et al. (2022). Thus, each RD is represented by a filled and an open symbol in these plots. Circles with error bars indicate measurements of the Lyα observables, whereas downward-pointing triangles indicate upper limits. Correlation coefficients (Kendall’s τ) and corresponding p-values for the kinematical inclinations are provided in the top-right corner of each panel.
) vs. galaxy inclination. Filled purple symbols are based on the kinematical inclination, i, from the disc modelling of the RDs with GalPak3D. Unfilled symbols are based on photometric inclinations (purple: RD; green: PR) according to cos(i)≈(b/a)I, where (b/a)I is the I-band axis ratio from Rasekh et al. (2022). Thus, each RD is represented by a filled and an open symbol in these plots. Circles with error bars indicate measurements of the Lyα observables, whereas downward-pointing triangles indicate upper limits. Correlation coefficients (Kendall’s τ) and corresponding p-values for the kinematical inclinations are provided in the top-right corner of each panel.
Current usage metrics show cumulative count of Article Views (full-text article views including HTML views, PDF and ePub downloads, according to the available data) and Abstracts Views on Vision4Press platform.
Data correspond to usage on the plateform after 2015. The current usage metrics is available 48-96 hours after online publication and is updated daily on week days.
Initial download of the metrics may take a while.