Fig. E.1.
Download original image
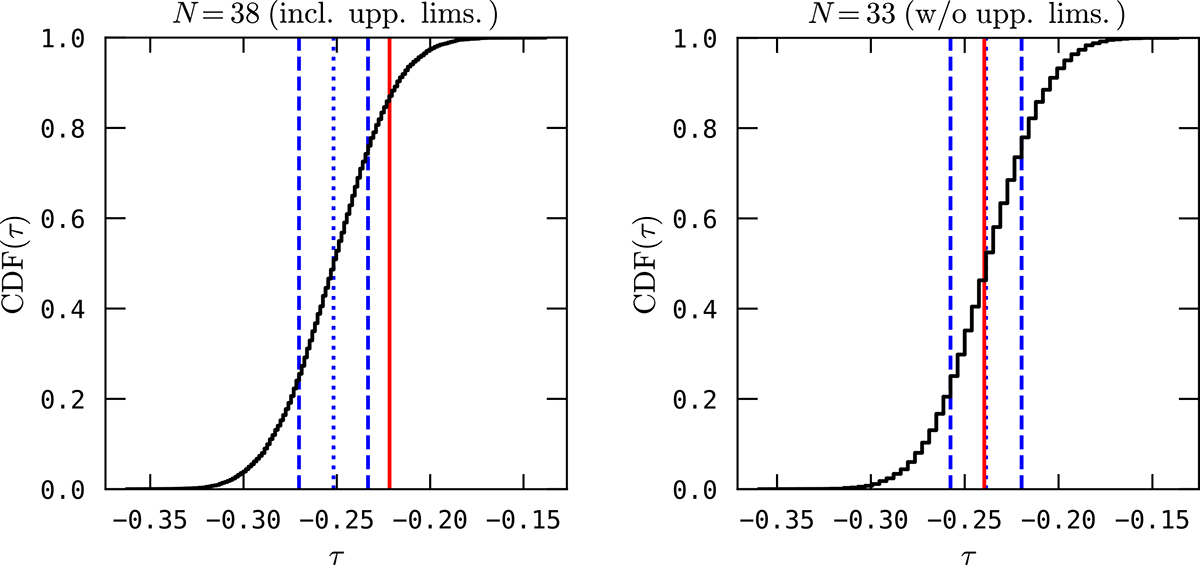
Examples of the adopted methodology to assess the robustness of the correlations presented in Appendix E. Both panels show the cumulative distribution of Kendall’s τ obtained from 104 Monte-Carlo simulations, where for each realisation the involved variables were perturbed according to their error-bars. The green dotted line shows the median of the distribution, which is adopted to calculate p0, whereas the blue dashed lines show the upper- and lower quartile. The solid red line shows the critical τ value according to Eq. (E.2). Both panels show the cumulative distribution of τ for the relation between vshear/σ0obs and ![]() , but the distribution in the left-hand panel is obtained for the sample of N = 38 galaxies analysed in Sect. 3.6 (exclusion of galaxies with double component Hα profiles), whereas the distribution in the right-hand panel is obtained for the subsample of N = 33 galaxies that is analysed in Sect. 4.1.1 (galaxies without upper limits in their Lyα observables).
, but the distribution in the left-hand panel is obtained for the sample of N = 38 galaxies analysed in Sect. 3.6 (exclusion of galaxies with double component Hα profiles), whereas the distribution in the right-hand panel is obtained for the subsample of N = 33 galaxies that is analysed in Sect. 4.1.1 (galaxies without upper limits in their Lyα observables).
Current usage metrics show cumulative count of Article Views (full-text article views including HTML views, PDF and ePub downloads, according to the available data) and Abstracts Views on Vision4Press platform.
Data correspond to usage on the plateform after 2015. The current usage metrics is available 48-96 hours after online publication and is updated daily on week days.
Initial download of the metrics may take a while.