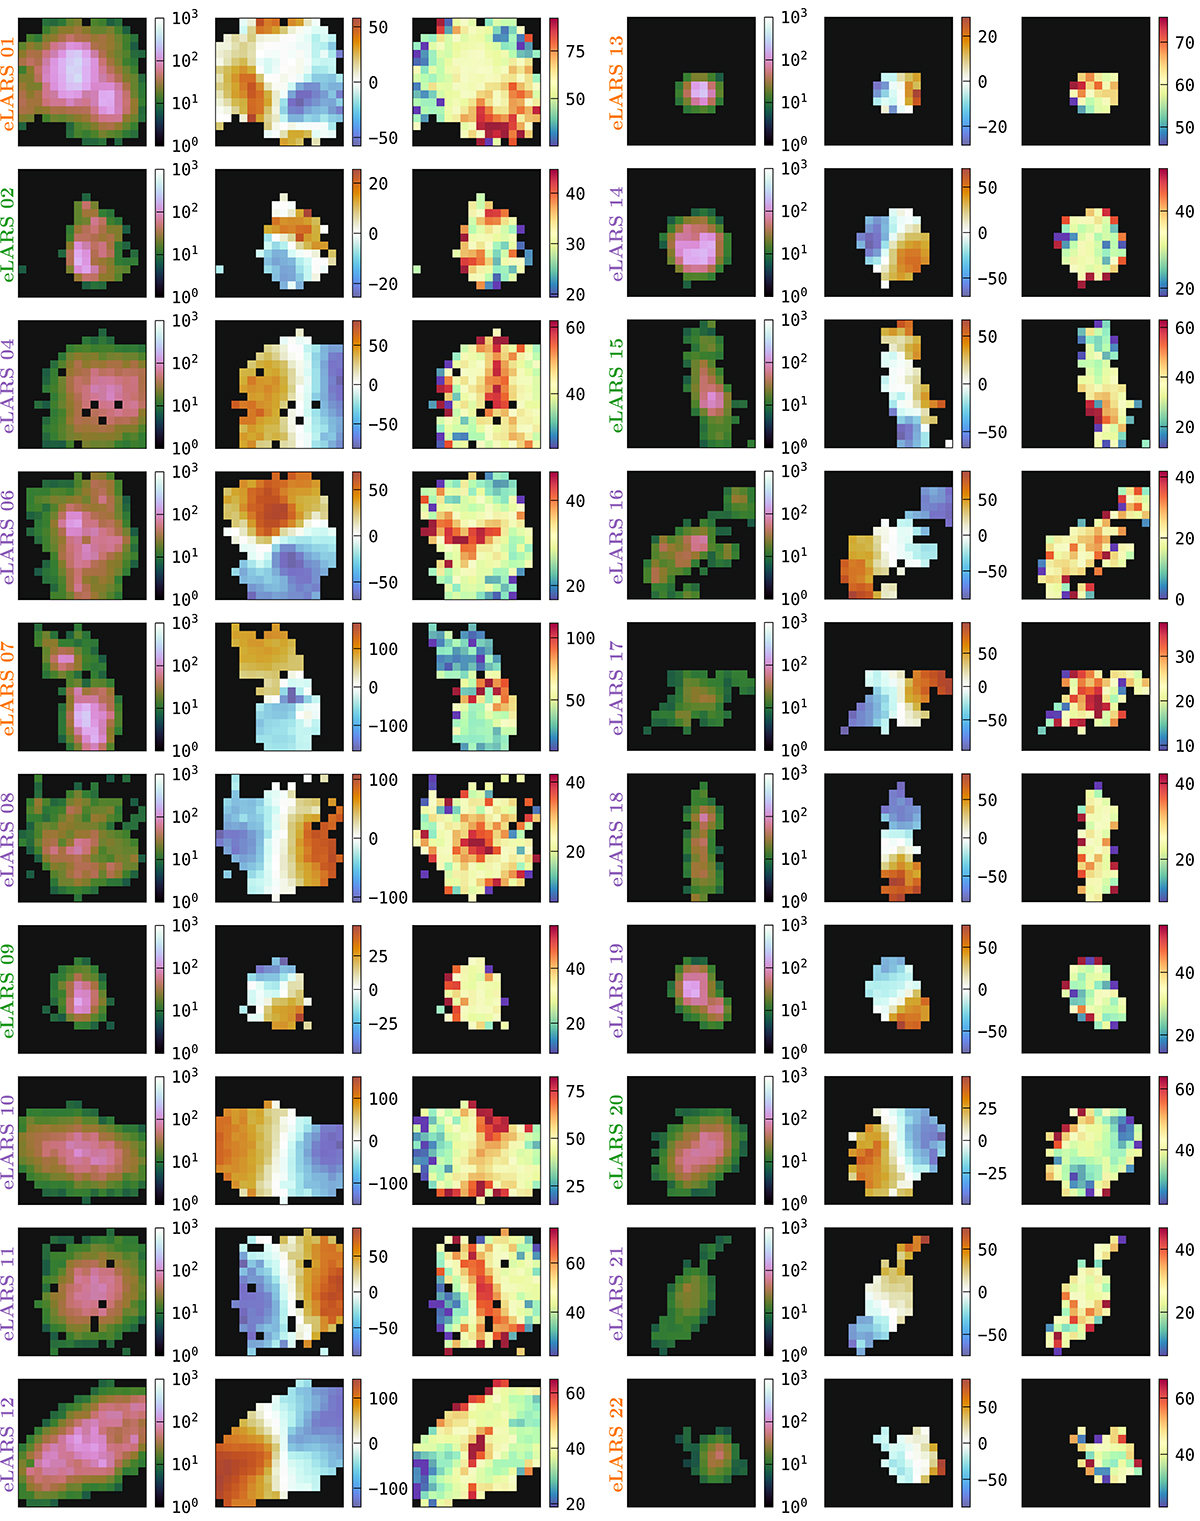
Fig. B.1.
Download original image
Hα kinematics of eLARS from PMAS (16″×16″ field of view). For each galaxy we show HαS/N (left panels; colour coded in log-scale from 1 to 1000), vlos [km s−1] (centre panels; approaching to receding velocities are colour coded linearly from blue to red with the centre at vlos = 0 in white and scaled symmetrically to the absolute maximum), and σv [km s−1] (right panels; colour coded linearly from the 2th-percentile, median, and 98-th percentile of the observed σv distribution per galaxy). The name of each galaxy is coloured according to the visual kinematic classification (Sect. 3.2): rotating discs in purple, perturbed rotators in green, and galaxies with complex kinematics in orange. Galaxies with two PMAS pointings are assembled at the bottom of this two-page figure.
Current usage metrics show cumulative count of Article Views (full-text article views including HTML views, PDF and ePub downloads, according to the available data) and Abstracts Views on Vision4Press platform.
Data correspond to usage on the plateform after 2015. The current usage metrics is available 48-96 hours after online publication and is updated daily on week days.
Initial download of the metrics may take a while.