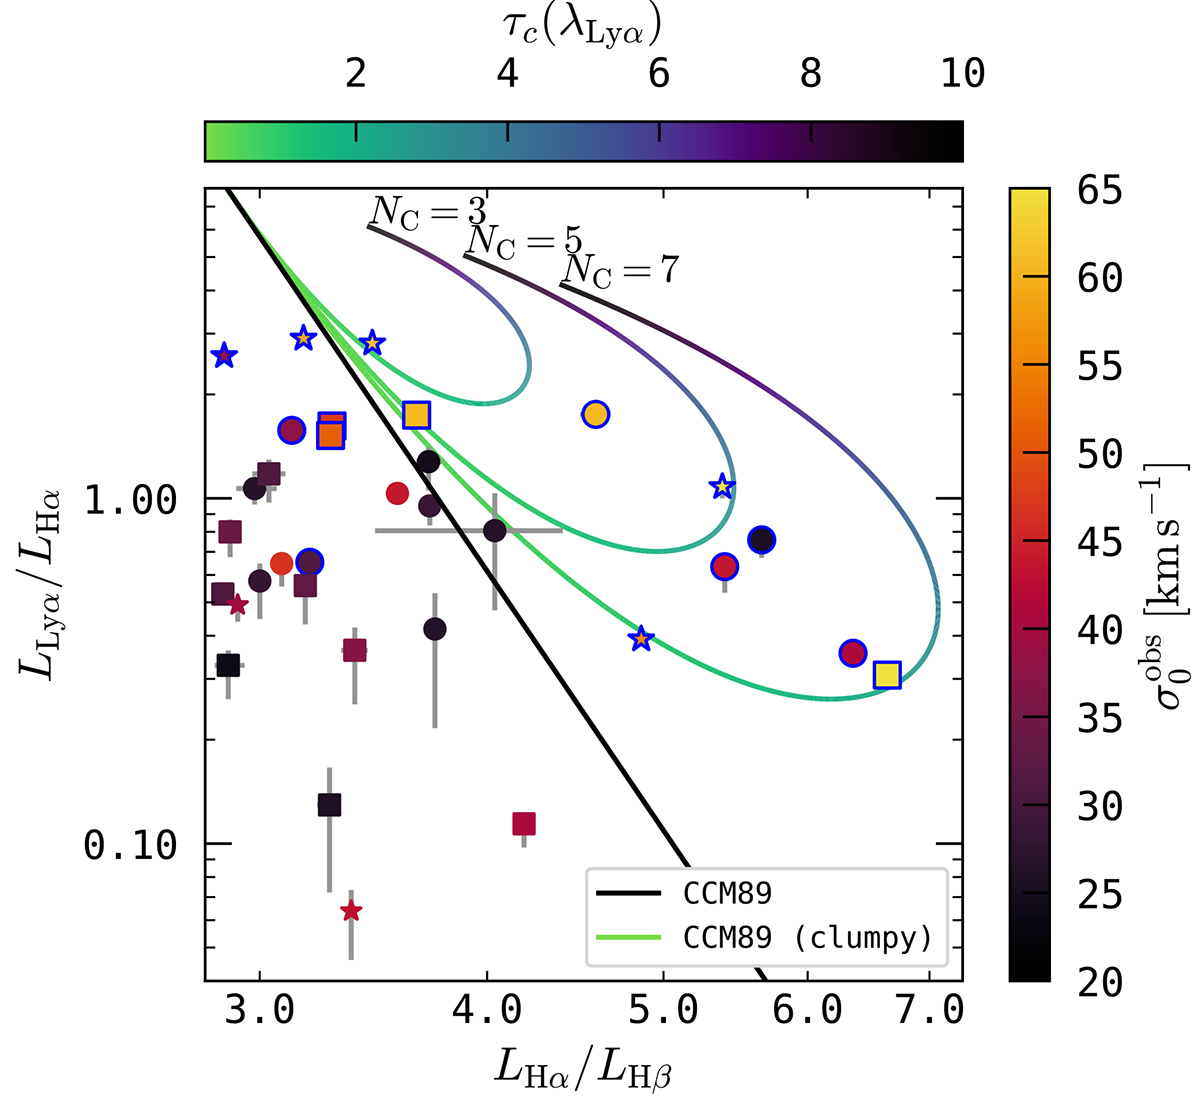
Fig. 14.
Download original image
Lyα/Hα ratio against the Hα/Hβ luminosity ratio for the in Sect. 4 analysed subsample of 33 galaxies as. there is no correlation between both quantities (τ = −0.09/pτ = 0.47). Symbols, colouring, and highlighting of the symbols is the same as in Fig. 13. The expectation of Lyα/Hα as a function of Hα/Hβ for a homogeneous dust-screen without radiative transfer effects in front of the line emission is shown as a solid line (Eq. (6)). The curves with a colour gradient indicate possible values for Lyα/Hα and Hα/Hβ for a clumpy dust screen, where on average NC = {3, 7, 9} clumps block the sight lines (Eq. (9)). These lines are drawn with a colour gradient that indicates the dust optical depth τC at 1216 Å of a single clump (colour bar at the top of the plot).
Current usage metrics show cumulative count of Article Views (full-text article views including HTML views, PDF and ePub downloads, according to the available data) and Abstracts Views on Vision4Press platform.
Data correspond to usage on the plateform after 2015. The current usage metrics is available 48-96 hours after online publication and is updated daily on week days.
Initial download of the metrics may take a while.