Fig. 13.
Download original image
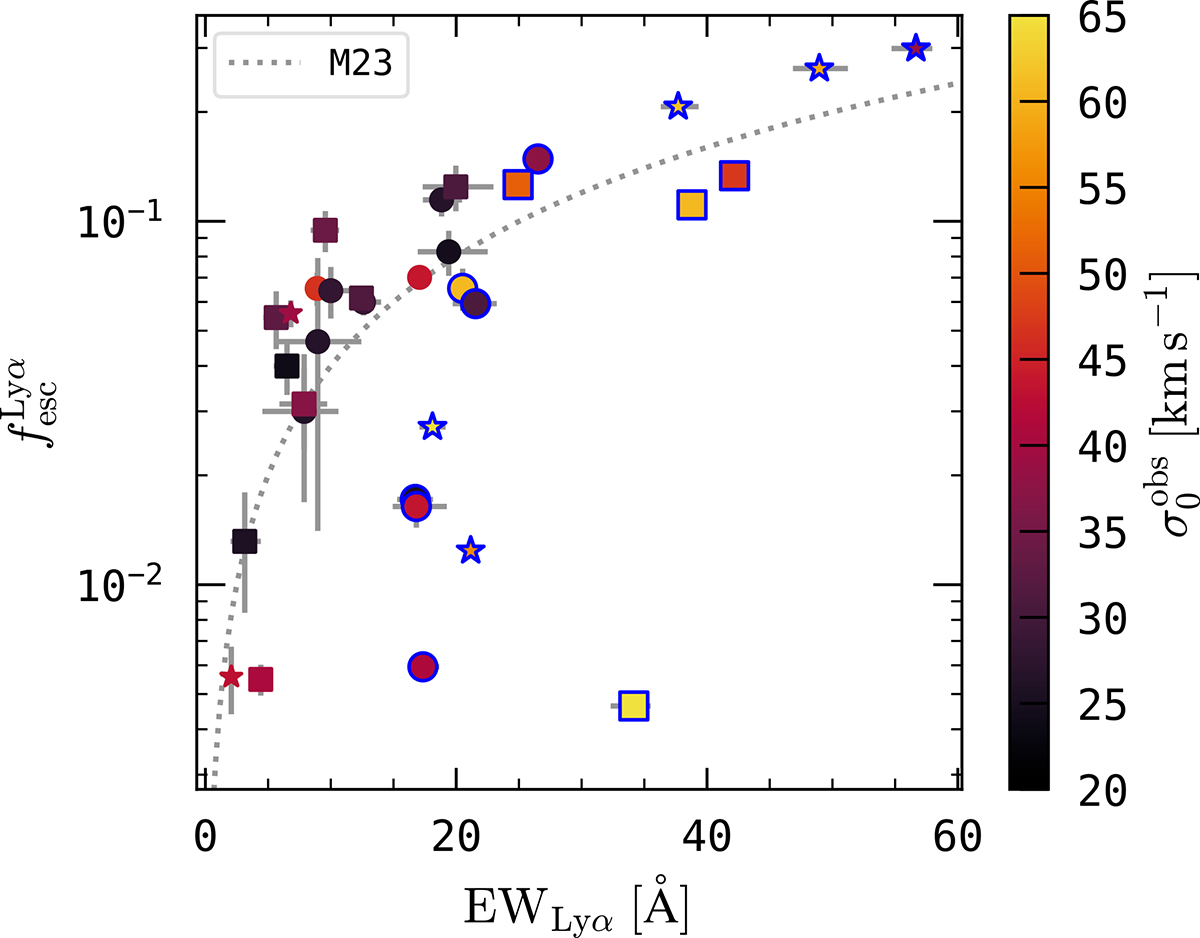
Lyα escape fraction, ![]() vs. Lyα equivalent width, EWLyα for the in Sect. 4 analysed subsample of 33 galaxies as in Fig. 12. Both quantities are highly correlated (τ = 0.453/pτ ∼ 10−3), even in a linear sense (Pearson’s r = 0.78/pr ≃ 10−7). The dotted line shows the linear fit to the whole sample from M23. Points are coloured according to
vs. Lyα equivalent width, EWLyα for the in Sect. 4 analysed subsample of 33 galaxies as in Fig. 12. Both quantities are highly correlated (τ = 0.453/pτ ∼ 10−3), even in a linear sense (Pearson’s r = 0.78/pr ≃ 10−7). The dotted line shows the linear fit to the whole sample from M23. Points are coloured according to ![]() as indicated by the colour bar on the right. Symbols are the same as in Fig. 12, but here we highlight by blue outlines the objects outside of the EWLyα and E(B − V)≤0.4 zone in Fig. 12.
as indicated by the colour bar on the right. Symbols are the same as in Fig. 12, but here we highlight by blue outlines the objects outside of the EWLyα and E(B − V)≤0.4 zone in Fig. 12.
Current usage metrics show cumulative count of Article Views (full-text article views including HTML views, PDF and ePub downloads, according to the available data) and Abstracts Views on Vision4Press platform.
Data correspond to usage on the plateform after 2015. The current usage metrics is available 48-96 hours after online publication and is updated daily on week days.
Initial download of the metrics may take a while.