Fig. 10.
Download original image
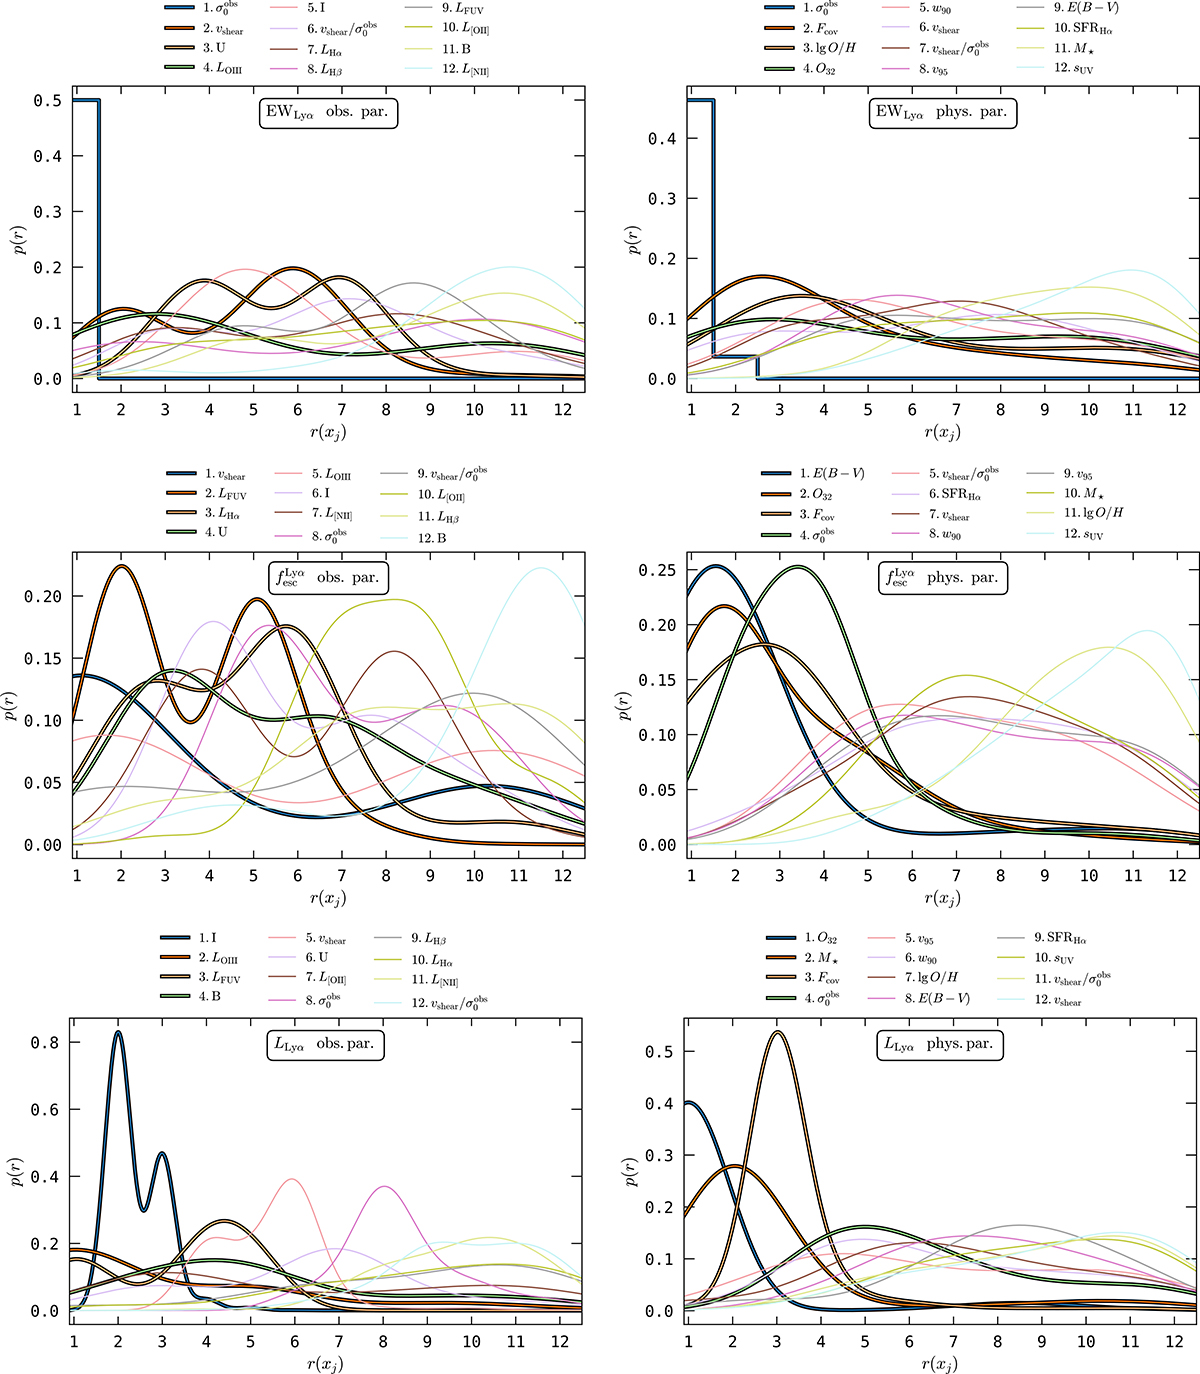
Visualisation of the parameter importance for responses EWLyα (top panels), fescLyα (middle panels), and LLyα (bottom panels) from a conditional perspective using step-wise regression in a multivariate linear regression framework (see Sect. 4.1.2 for details). The panels on the left- and right-hand sides visualise the distribution of rankings p(r(xi)) for the parameters xi from the observational and physical parameter sets, respectively, where each set includes the kinematical parameters that have been derived in this work. Low values of r(xi) indicate a high importance of xi, whereas high values indicate a low importance. All but two of the curves were obtained using a kernel-density estimator (Gaussian kernel, width = 0.5) on the ranks from NMC = 103 Monte Carlo realisations. The exceptions are the ![]() curves for the response EWLyα (see footnote 7). The four most important parameters according to Eq. (5) are shown with bold lines, whereas the remaining ranks are shown with thin lines and in subdued colours. The legend at the top of each panel is sorted according to the ranks from Eq. (5), which are also listed in Table 2.
curves for the response EWLyα (see footnote 7). The four most important parameters according to Eq. (5) are shown with bold lines, whereas the remaining ranks are shown with thin lines and in subdued colours. The legend at the top of each panel is sorted according to the ranks from Eq. (5), which are also listed in Table 2.
Current usage metrics show cumulative count of Article Views (full-text article views including HTML views, PDF and ePub downloads, according to the available data) and Abstracts Views on Vision4Press platform.
Data correspond to usage on the plateform after 2015. The current usage metrics is available 48-96 hours after online publication and is updated daily on week days.
Initial download of the metrics may take a while.