Fig. 9
Download original image
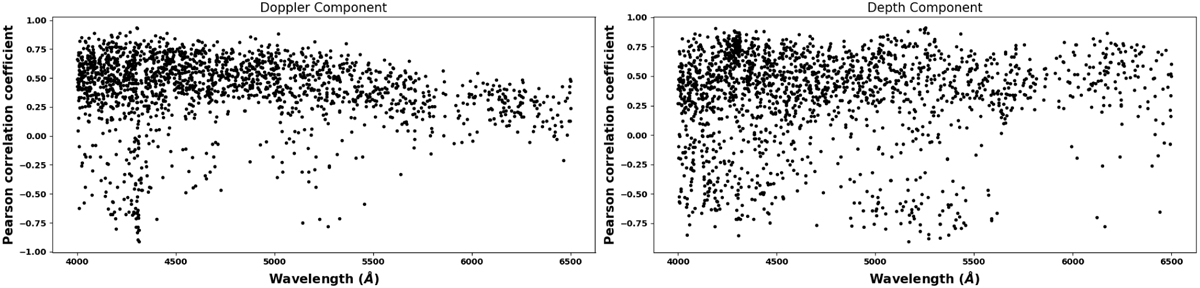
Line similarity in the wavelength domain for the SDO-based SOAP-GPU simulation using the PHOENIX input seed spectra (see Sect. 2.2). Left: similarity of line profiles associated with the Doppler component. Line similarity decreases with wavelength, and therefore it seems that the SDO-based SOAP-GPU simulation can model blue lines better than red lines. This is likely due to telluric line contamination at the red part of the HARPS-N solar spectra. Right: similarity of line profiles associated with the depth component. There is no correlation between the Pearson correlation coefficient value and wavelength.
Current usage metrics show cumulative count of Article Views (full-text article views including HTML views, PDF and ePub downloads, according to the available data) and Abstracts Views on Vision4Press platform.
Data correspond to usage on the plateform after 2015. The current usage metrics is available 48-96 hours after online publication and is updated daily on week days.
Initial download of the metrics may take a while.