Fig. 7
Download original image
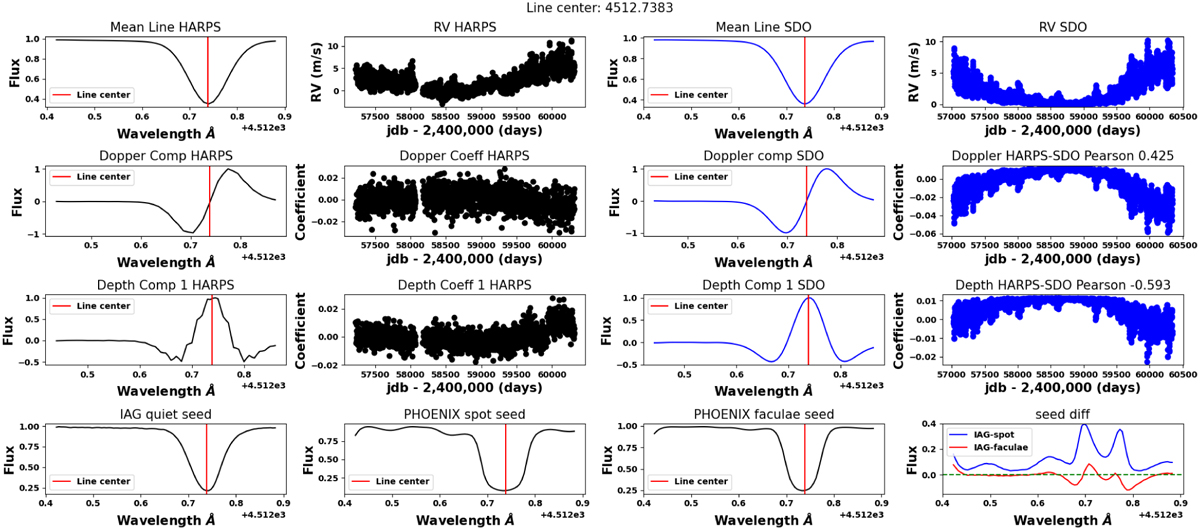
Similar to Fig. 6, but for the FeI line at 4512.74 Å from the IAG case. It has a negative Pearson correlation coefficient value of −0.593 for the depth coefficients. An additional row is added to highlight the input seed spectral line profile used in this simulation. Fourth row: Line profile of the IAG spectrum at μ = 1.0 for modeling the quiet Sun and line profiles from the PHOENIX spectral library for modeling spot and facula regions. The last panel in this row shows the line profile difference between the input seed spectrum of the quiet Sun and the input seed spectra of the active regions. A horizontal green dashed line indicates the zero level. The profile of ΔSbconv,quiet–faculae has regions greater than zero, which is not expected.
Current usage metrics show cumulative count of Article Views (full-text article views including HTML views, PDF and ePub downloads, according to the available data) and Abstracts Views on Vision4Press platform.
Data correspond to usage on the plateform after 2015. The current usage metrics is available 48-96 hours after online publication and is updated daily on week days.
Initial download of the metrics may take a while.