Fig. 5

Download original image
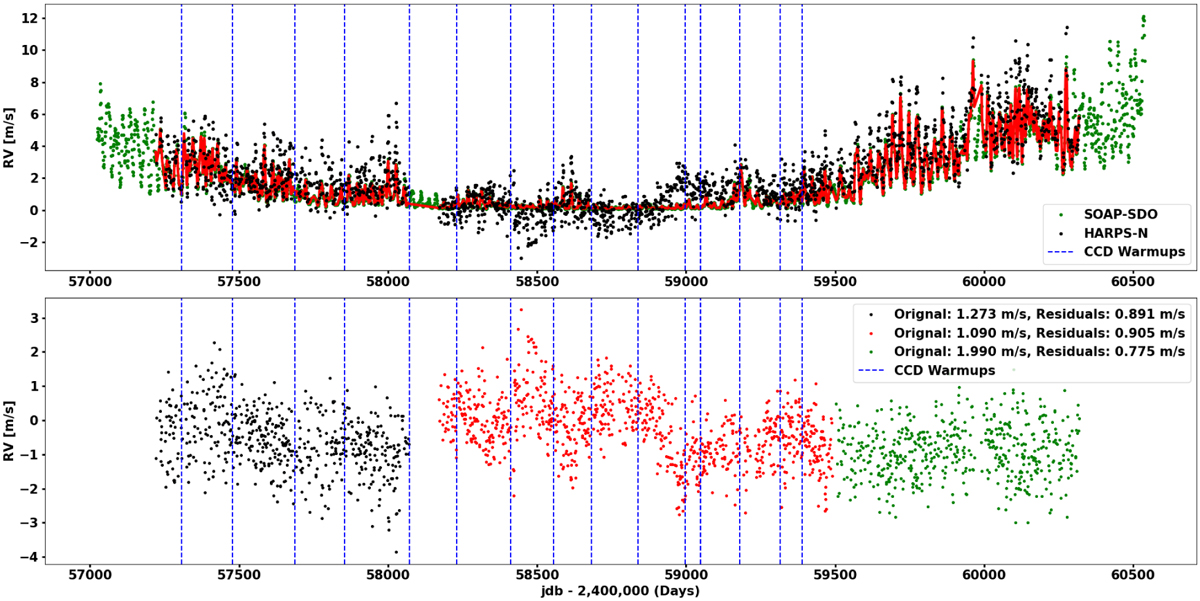
RV data of simulated spectral time series modeled with SDO images. The input seed spectra generated from the PHOENIX synthetic spectral library are used as the inputs of SOAP-GPU (see Sect. 2.2). Top: RV comparison between the SOAP-GPU simulated spectra and HARPS-N solar spectra. The RVs derived from the simulated spectra are highlighted in green while the RVs derived from HARPS-N solar spectra are shown in black. We interpolated the simulated RV time series (in red) to match the HARPS-N solar observation. The blue dashed vertical lines indicate the times of the CCD warm-ups. Bottom: residuals after subtracting simulated RVs from the HARPS-N solar RVs. The RV residuals are divided into three phases: the decreasing cycle 24 activity phase (black), the quiet phase (red), and the new increasing activity phase of cycle 25 (green). The corresponding rms are 0.891 m/s, 0.905 m/s, and 0.775 m/s, respectively. The rms of HARPS-N solar spectra for these three phases are 1.273 m/s, 1.090 m/s, and 1.990 m/s, and are shown here for comparison.
Current usage metrics show cumulative count of Article Views (full-text article views including HTML views, PDF and ePub downloads, according to the available data) and Abstracts Views on Vision4Press platform.
Data correspond to usage on the plateform after 2015. The current usage metrics is available 48-96 hours after online publication and is updated daily on week days.
Initial download of the metrics may take a while.


