Fig. 4
Download original image
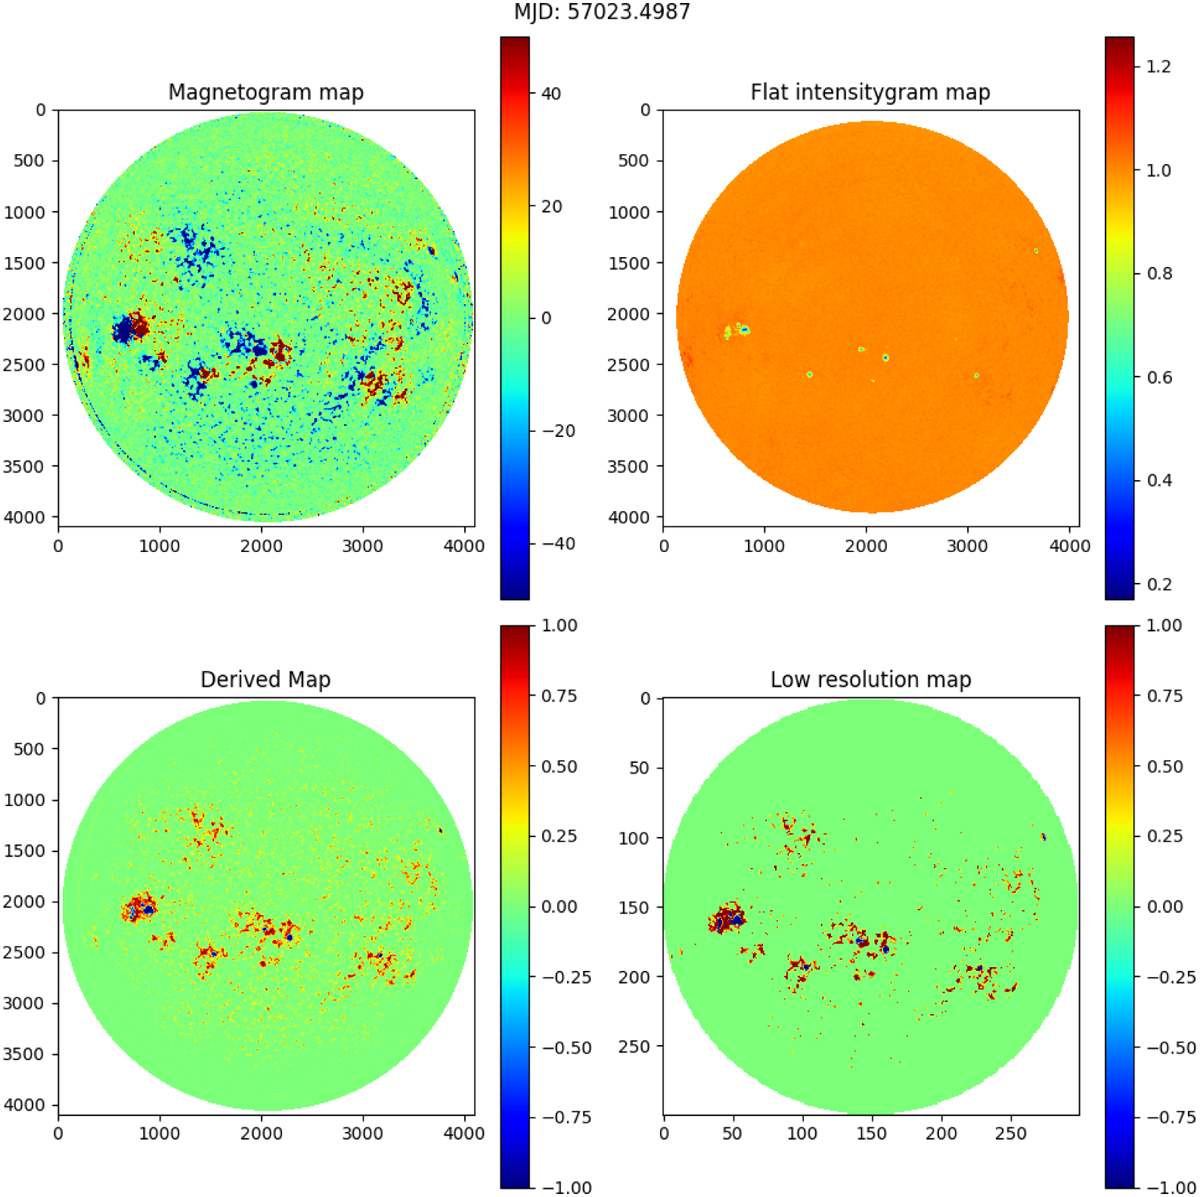
Pre-processing of SDO manetogram and flattened intensitygram images to derive active regions. Top left: original SDO manetogram image. Regions with positive and negative magnetic fields are labeled in red and blue, respectively. Top right: original SDO flattened intensitygram image. Regions with high contrast (in green) indicate the presence of spots. Bottom left: derived high-resolution active region location with a dimension of 3900 × 3900. The facula regions are in red, while the spots are in blue. Bottom right: low-resolution map of active regions with a size of 300 × 300, used as input of SOAP-GPU to speed up computation.
Current usage metrics show cumulative count of Article Views (full-text article views including HTML views, PDF and ePub downloads, according to the available data) and Abstracts Views on Vision4Press platform.
Data correspond to usage on the plateform after 2015. The current usage metrics is available 48-96 hours after online publication and is updated daily on week days.
Initial download of the metrics may take a while.