Fig. 3
Download original image
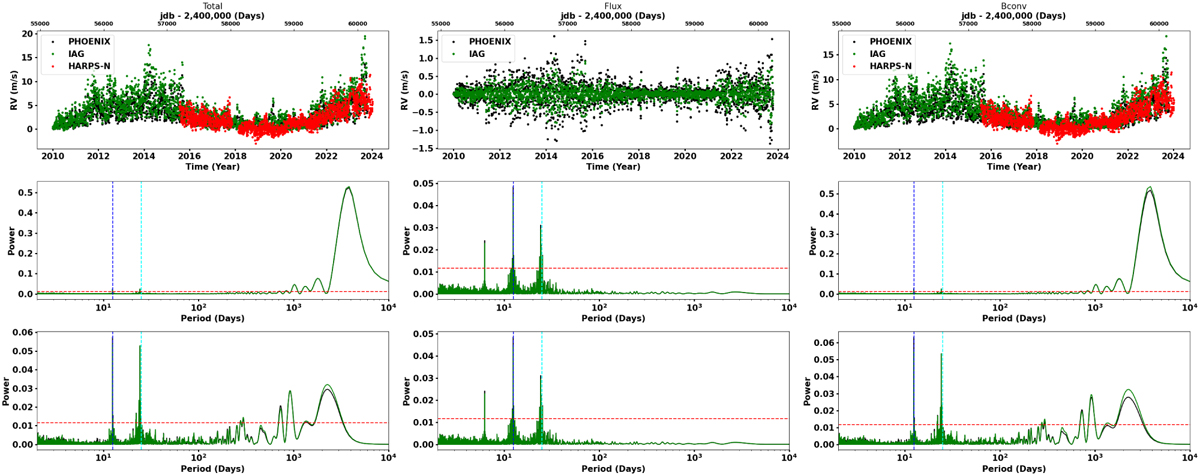
RV time series and periodograms from the solar simulations using spot number as input. In each panel we show the results for the PHOENIX and IAG cases in black and green, respectively. Top: from left to right, we show the RVs of the total effect, flux effect, and the effect of CB inhibition. The RVs of the HARPS-N solar observation, in red, are also illustrated in the left and right panels for comparison. Middle: corresponding periodograms for each effect. The FAP level of 0.1% is represented by the red dashed line. The half rotation and the rotation period of the Sun are indicated with blue and cyan dashed lines. Bottom: corresponding periodograms of each effect, but with the magnetic cycle removed. Since the RVs from the flux effect are not affected by the long-term trend induced by the magnetic cycle, the periodogram remains the same.
Current usage metrics show cumulative count of Article Views (full-text article views including HTML views, PDF and ePub downloads, according to the available data) and Abstracts Views on Vision4Press platform.
Data correspond to usage on the plateform after 2015. The current usage metrics is available 48-96 hours after online publication and is updated daily on week days.
Initial download of the metrics may take a while.