Fig. 10
Download original image
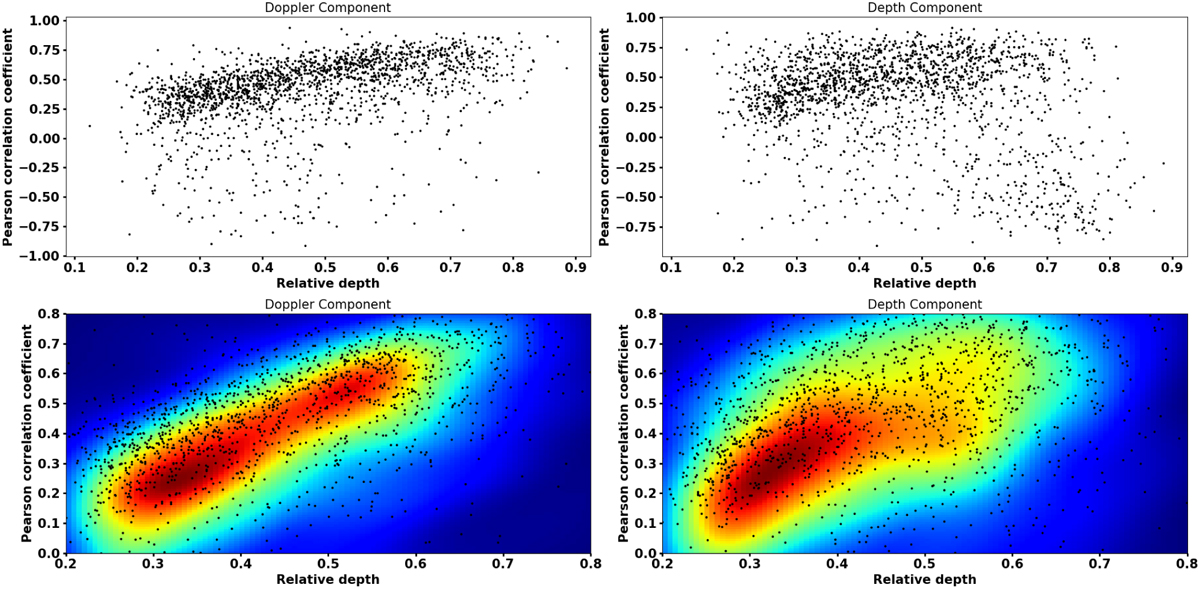
Line similarity in the relative line depth domain for the SDO-based SOAP-GPU simulation using the PHOENIX input seed spectra (see Sect. 2.2). Top left: similarity of line profiles associated with the Doppler component. Bottom left: similar to the top left panel, but displaying only lines with Pearson correlation coefficient values greater than 0.0. Kernel density estimation is used for better visualization of the data distribution. There is a strong linear correlation between the line profile similarity and the relative line depth as the strong lines show higher similarity than the weak lines. This is likely because the strong lines have a higher signal-to-noise ratio than the weak lines. Top right: similarity of line profiles associated with the depth component. Bottom right: similar to the top right panel, but displaying only lines with Pearson correlation coefficient values greater than 0.0. Kernel density estimation is used for better visualization of the data distribution. A strong linear correlation is visible at relative line depth smaller than 0.4, where the lines are photon-limited. Beyond 0.4 the data is more uniformly distributed.
Current usage metrics show cumulative count of Article Views (full-text article views including HTML views, PDF and ePub downloads, according to the available data) and Abstracts Views on Vision4Press platform.
Data correspond to usage on the plateform after 2015. The current usage metrics is available 48-96 hours after online publication and is updated daily on week days.
Initial download of the metrics may take a while.