Fig. 1
Download original image
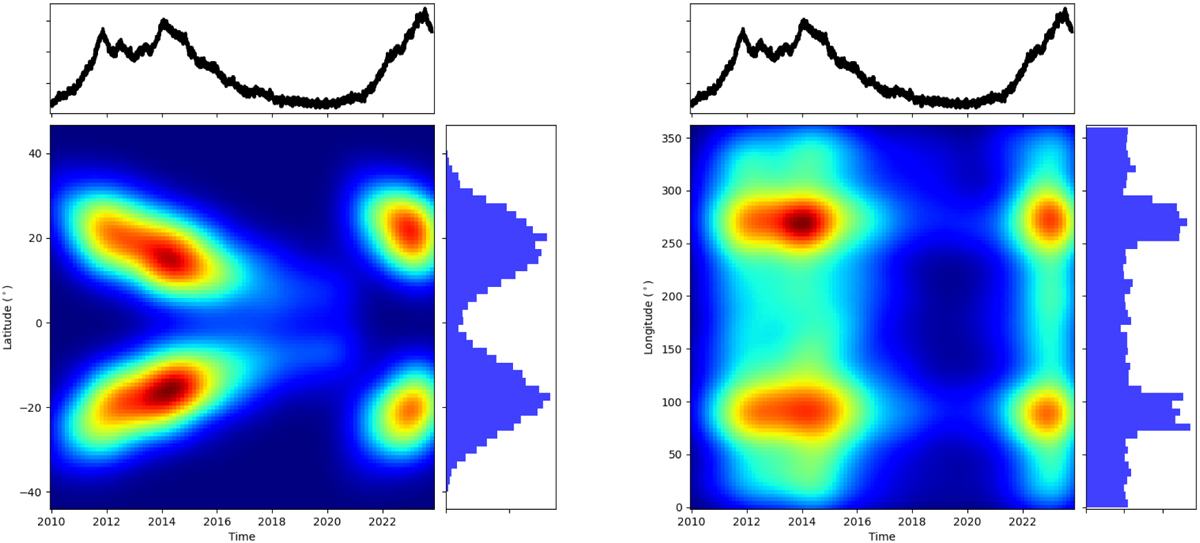
Location of active regions initialized with spot number evolution curve as a function of time. Left: latitude evolution of injected active regions. The spot number evolution curve derived from the Solar Influences Analysis Data Center (SIDC) is shown in the top panel. The latitude distribution shown in the histogram on the right indicates that the north-south asymmetry factor is 0.5. The butterfly diagram is shown in the density map. Right: longitude evolution of injected active regions. The spot number evolution curve derived from the SIDC is shown in the top panel. The longitude distribution shown in the histogram on the right indicates that the two considered active longitude regions are separated by 180 degrees.
Current usage metrics show cumulative count of Article Views (full-text article views including HTML views, PDF and ePub downloads, according to the available data) and Abstracts Views on Vision4Press platform.
Data correspond to usage on the plateform after 2015. The current usage metrics is available 48-96 hours after online publication and is updated daily on week days.
Initial download of the metrics may take a while.