Fig. 7.
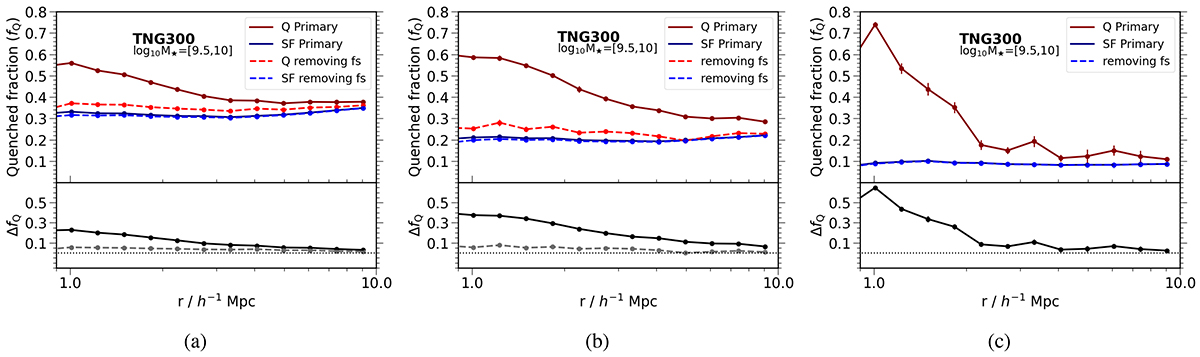
Download original image
Conformity signal in TNG300 at z = 0 (left), z ∼ 0.3 (middle), and z ∼ 1 (right). The upper panels show the mean quenched fraction of secondary galaxies for both quenched (red) and star-forming (blue) primary galaxies before (solid lines) and after (dashed lines) removing former satellites. The bottom panels show how the conformity signal varies before (black solid line) and after (gray dashed line) removing former satellites, until 10 h−1 Mpc distances from primary galaxies.
Current usage metrics show cumulative count of Article Views (full-text article views including HTML views, PDF and ePub downloads, according to the available data) and Abstracts Views on Vision4Press platform.
Data correspond to usage on the plateform after 2015. The current usage metrics is available 48-96 hours after online publication and is updated daily on week days.
Initial download of the metrics may take a while.