Open Access
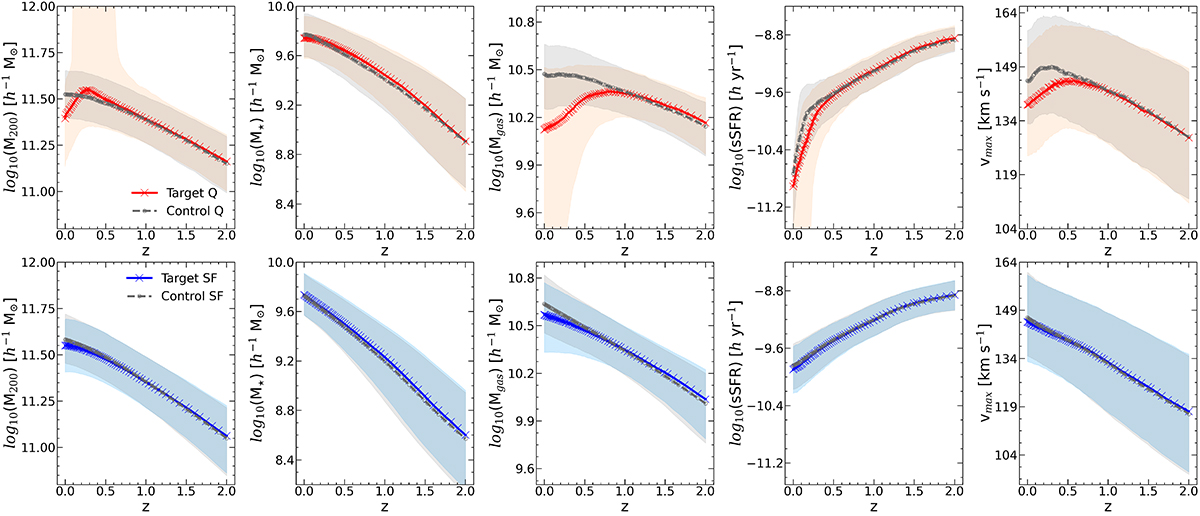
Fig. 2.
Download original image
Same parameters as Fig. 1. The upper panels show the median trends for Q galaxies (target sample in red, control sample in gray), and the lower panels show the SF galaxies for the target (blue) and control (gray) samples in TNG300.
Current usage metrics show cumulative count of Article Views (full-text article views including HTML views, PDF and ePub downloads, according to the available data) and Abstracts Views on Vision4Press platform.
Data correspond to usage on the plateform after 2015. The current usage metrics is available 48-96 hours after online publication and is updated daily on week days.
Initial download of the metrics may take a while.