Fig. B.1
Download original image
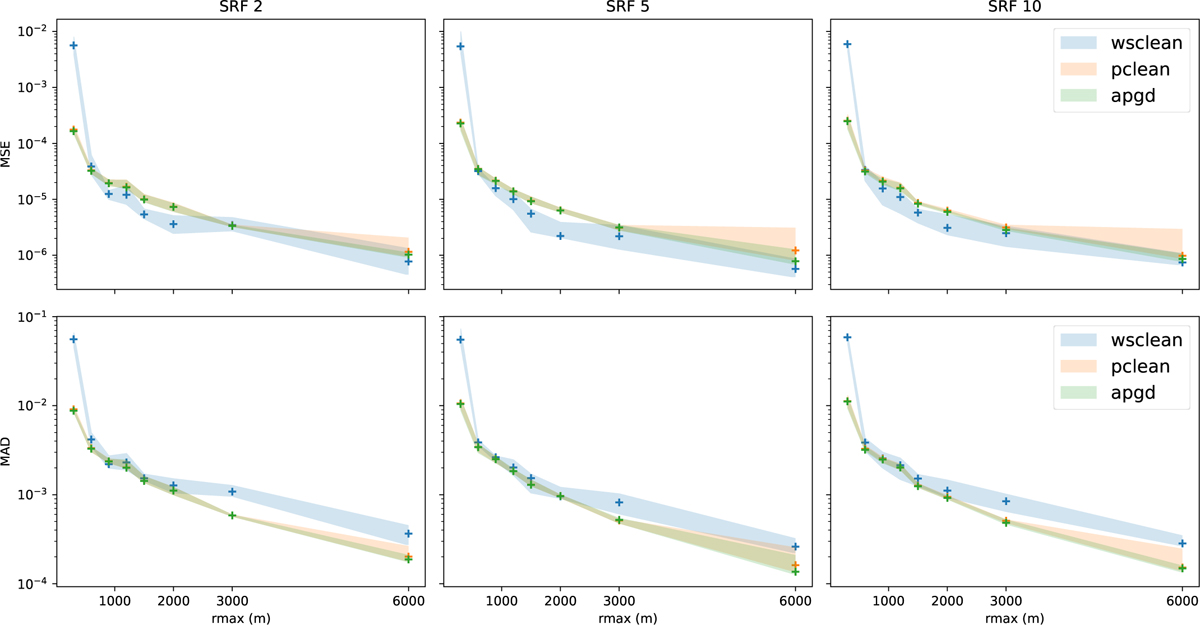
Comparative view of the reconstruction errors on the simulated images during the experiment of Sect. 6.1. Median values over the 10 repetitions of the experiments are reported with the crosses and the transparent areas cover the interquartile spread. MSE appears on the first row, MAD on the second one. The metrics are computed after convolution with the CLEAN beam. Each column is a different super resolution factor: 2, 5, 10 (from left to right). We observe that the metrics have similar values between CLEAN and the LASSO-based methods (PolyCLEAN and APGD). This indicates that the different algorithms are indeed configured to return images of similar quality and thus the comparison between the solving times performed in the experiment is relevant.
Current usage metrics show cumulative count of Article Views (full-text article views including HTML views, PDF and ePub downloads, according to the available data) and Abstracts Views on Vision4Press platform.
Data correspond to usage on the plateform after 2015. The current usage metrics is available 48-96 hours after online publication and is updated daily on week days.
Initial download of the metrics may take a while.