Fig. 8
Download original image
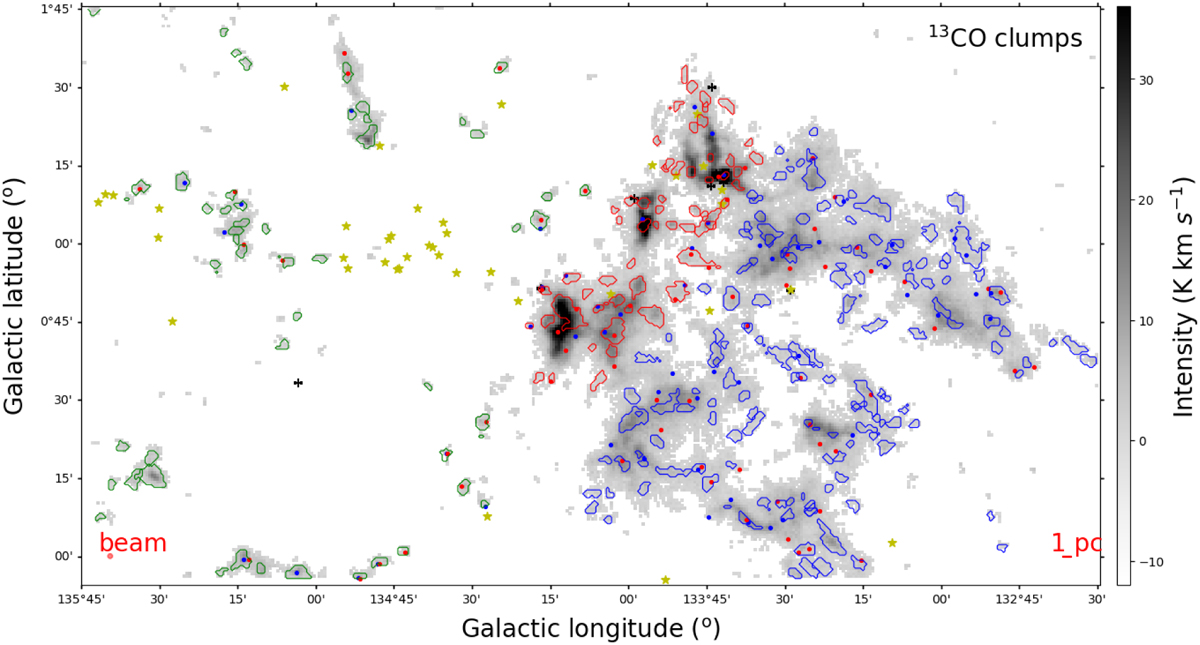
Distribution of bubble clumps (green contours), HDL clumps (red contours) and quiescent clumps (blue contours) classified according to their position distribution relative to the super bubble W4. The gray background image represents the integrated intensity map of 13CO. The yellow stars, black crosses, and small red and blue dots correspond to OB stars (Roman-Lopes et al. 2019), HMYSOs (Lumsden et al. 2013) and red and blue lobes identified as CO outflows by Li et al. (2019), respectively.
Current usage metrics show cumulative count of Article Views (full-text article views including HTML views, PDF and ePub downloads, according to the available data) and Abstracts Views on Vision4Press platform.
Data correspond to usage on the plateform after 2015. The current usage metrics is available 48-96 hours after online publication and is updated daily on week days.
Initial download of the metrics may take a while.