Fig. 5
Download original image
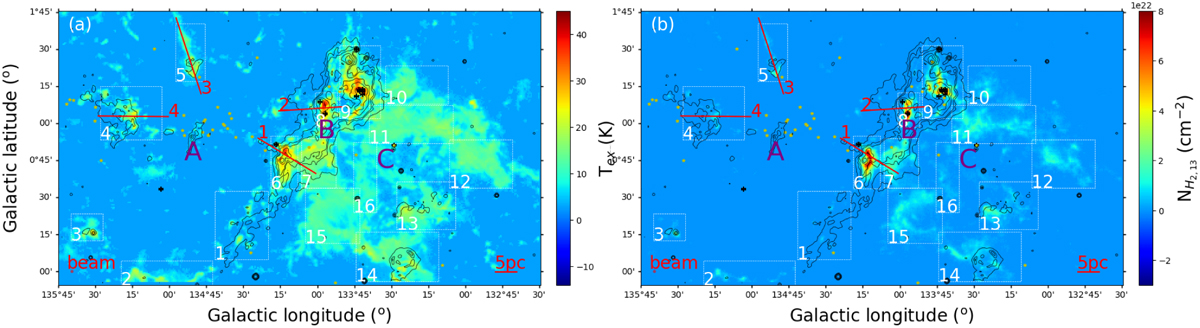
Maps of (a) CO excitation temperature distributions and (b) H2 column density distribution traced by 13CO. The black contour line corresponds to the intensity of the 8 µm flux starting at 1.3 × 10⁻⁶ W/(m−2 sr) and going up in steps of 5 × 10⁻⁶ W/(m−2 sr). The four red lines are the intercepted paths for the four parameter (12CO intensity, H2 column density, Tex, and 8 µm flux) value distributions in the Fig. 7, and the red numbers indicate the starting position of each path. The yellow stars and black crosses are same as Fig. 2.
Current usage metrics show cumulative count of Article Views (full-text article views including HTML views, PDF and ePub downloads, according to the available data) and Abstracts Views on Vision4Press platform.
Data correspond to usage on the plateform after 2015. The current usage metrics is available 48-96 hours after online publication and is updated daily on week days.
Initial download of the metrics may take a while.