Fig. 4
Download original image
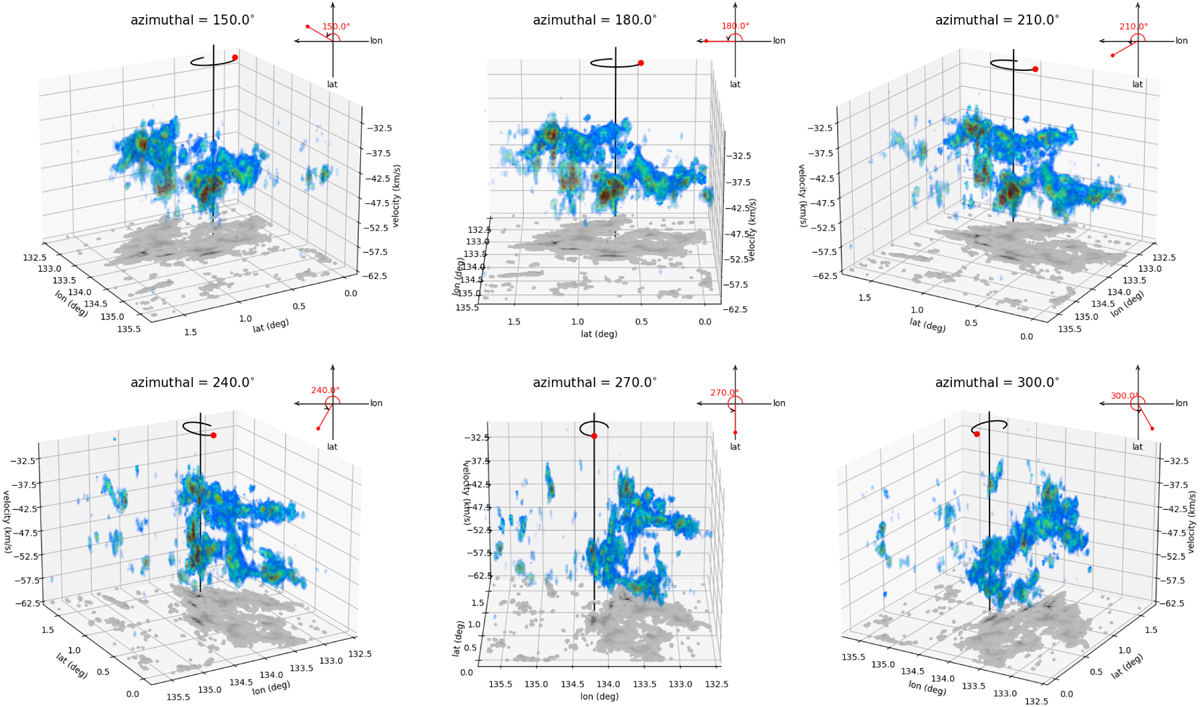
Six different perspectives of the 13CO J = 1−0 PPV-Tmb intensity map described in Fig. 3a. An azimuth angle of 180° leads to an x-axis parallel to the longitude axis. Rotating clockwise, we chose 150°, 180°, 210°, 240°, 270° and 300° to elucidate the structure of the W3/4 complex. The upper right corner of each subgraph shows a schematic representation of the azimuth coordinates in the longitude and latitude planes, and the red dot indicates the angle of view corresponding to the azimuth. The black solid line represents the rotation axis, while the curve above the axis and the red dot depict the trajectory and direction of the rotation axis, respectively.
Current usage metrics show cumulative count of Article Views (full-text article views including HTML views, PDF and ePub downloads, according to the available data) and Abstracts Views on Vision4Press platform.
Data correspond to usage on the plateform after 2015. The current usage metrics is available 48-96 hours after online publication and is updated daily on week days.
Initial download of the metrics may take a while.