Fig. 3
Download original image
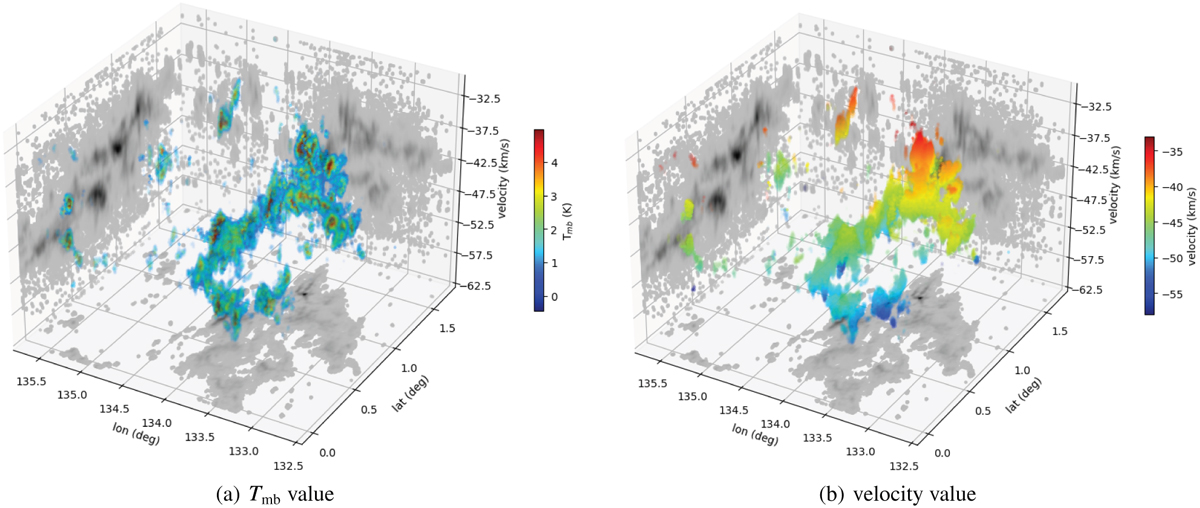
(a) PPV (position–position–velocity) Tmb intensity map of 13CO emission in W3/4. (b) PPV velocity map (the velocity at the Tmb peak in each voxel) of 13CO in W3/4. The intensity map on the background panel corresponds to the Tmb projection of the PPV map in that direction. A C-shaped morphology of the gas is revealed by the left panel at lower galactic longitudes.
Current usage metrics show cumulative count of Article Views (full-text article views including HTML views, PDF and ePub downloads, according to the available data) and Abstracts Views on Vision4Press platform.
Data correspond to usage on the plateform after 2015. The current usage metrics is available 48-96 hours after online publication and is updated daily on week days.
Initial download of the metrics may take a while.