Fig. 2
Download original image
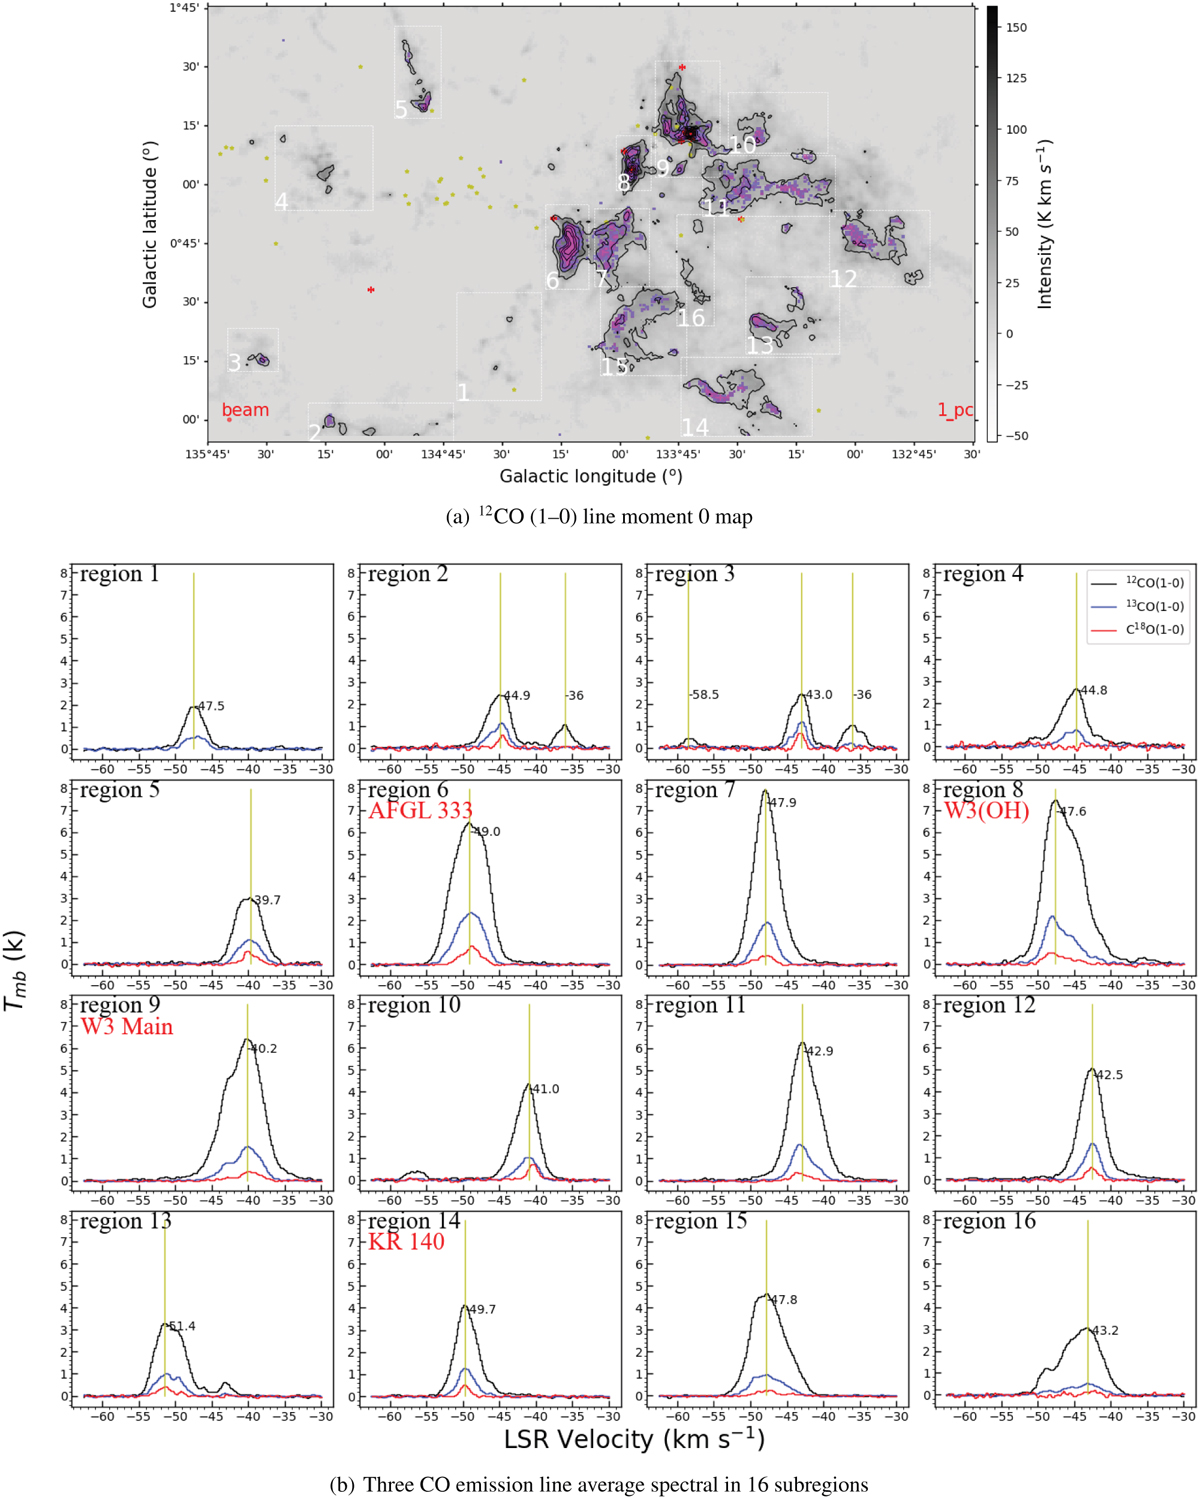
12CO (1−0) moment 0 map and average spectra of sixteen sub-regions for the W3/4 region. (a) 12CO (1−0) moment 0 (velocity integrated intensity) map of the W3/4 region. The integrated Local Standard of Rest velocity range is −63 to −30 km s−1. The black contour line is the 13CO intensity in the integrated Local Standard of Rest velocity range from −63 to −28 km s−1, starting at 10 K km s−1 (3σ) on a main beam brightness temperature scale and going up in steps of 15 K km s−1. The red areas refer to positions with notable C18O emission. Sixteen dotted boxes mark the dense areas in the whole W3/4 region. The yellow stars and red crosses correspond to OB stars (Roman-Lopes et al. 2019) and high-mass young stellar objects (HMYSOs) (Lumsden et al. 2013), respectively. (b) Average spectra of the sixteen sub-regions for the 12CO (black), 13CO (blue) and C18O (red) J = 1−0 emission lines. The yellow dotted line in each sub-region marks the velocity value corresponding to the peak of the 12CO average spectrum. The upper left corner of each sub-map shows the corresponding sub-region given in (a).
Current usage metrics show cumulative count of Article Views (full-text article views including HTML views, PDF and ePub downloads, according to the available data) and Abstracts Views on Vision4Press platform.
Data correspond to usage on the plateform after 2015. The current usage metrics is available 48-96 hours after online publication and is updated daily on week days.
Initial download of the metrics may take a while.