Fig. 9.
Download original image
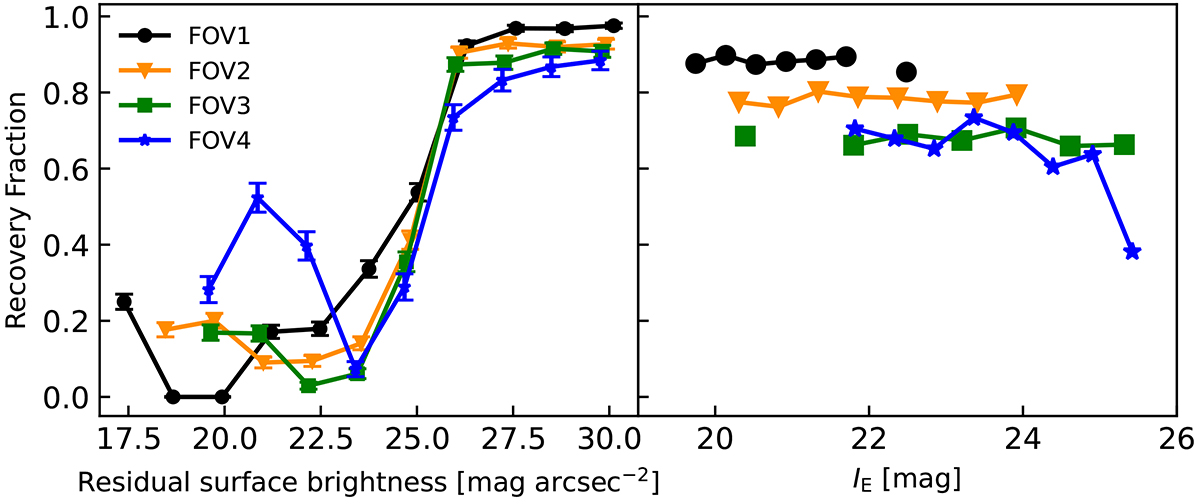
Recovery fraction of GCs. Left panel: Fraction of added GCs that have been detected by the Euclid photometric pipeline as a function of the local residual surface brightness at the location of the GC. The four different symbols are denoting the different configurations of the simulations. Right panel: Fraction of detected GCs by the Euclid photometric pipeline as a function of the total input GC IE magnitude. The Color codding is the same in both panels.
Current usage metrics show cumulative count of Article Views (full-text article views including HTML views, PDF and ePub downloads, according to the available data) and Abstracts Views on Vision4Press platform.
Data correspond to usage on the plateform after 2015. The current usage metrics is available 48-96 hours after online publication and is updated daily on week days.
Initial download of the metrics may take a while.