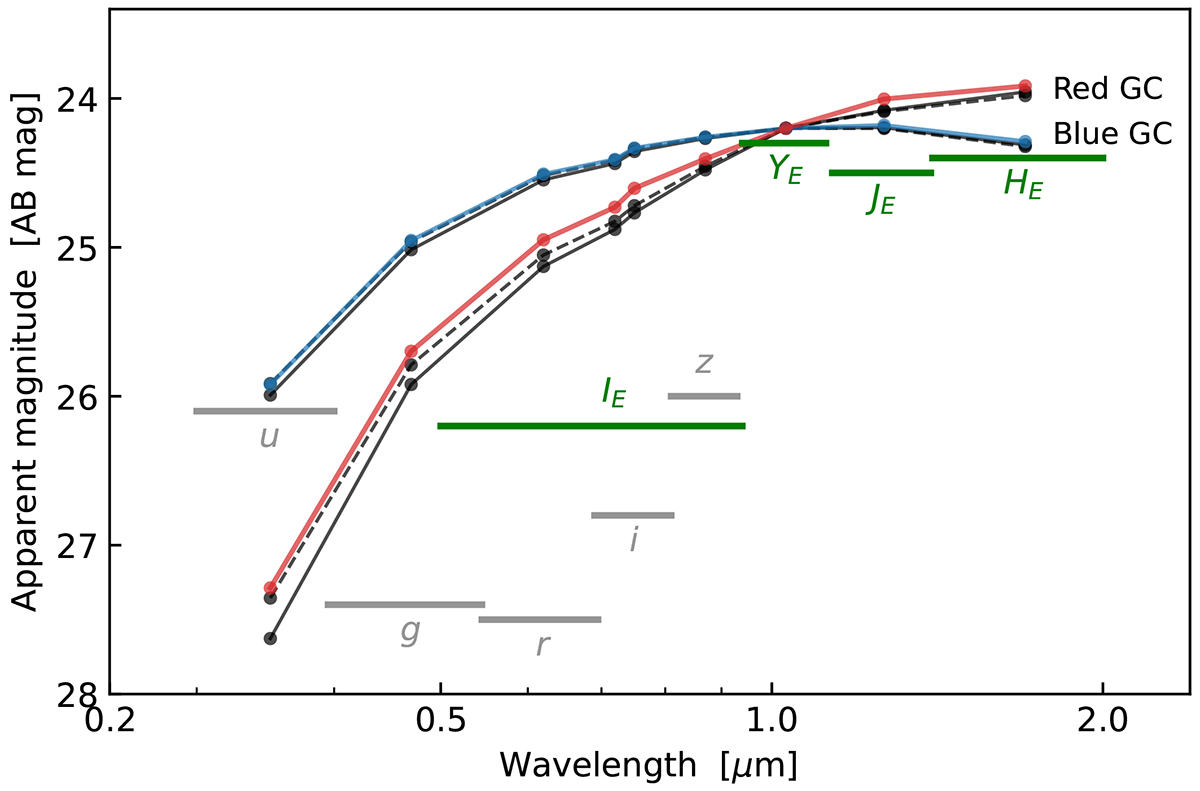
Fig. 7.
Download original image
Spectral energy distribution of a typical red GC ([M/H] ≃ −0.2) and blue GC ([M/H] ≃ −2), as predicted at ages of 8 Gyr (dashed) or 13 Gyr (solid) with two population synthesis models. In red, the detection limits of the four Euclid passbands IE, YE, JE, and HE are shown, together with the 10 yr LSST survey limits for the ugriz bands.
Current usage metrics show cumulative count of Article Views (full-text article views including HTML views, PDF and ePub downloads, according to the available data) and Abstracts Views on Vision4Press platform.
Data correspond to usage on the plateform after 2015. The current usage metrics is available 48-96 hours after online publication and is updated daily on week days.
Initial download of the metrics may take a while.