Open Access
Fig. 4.
Download original image
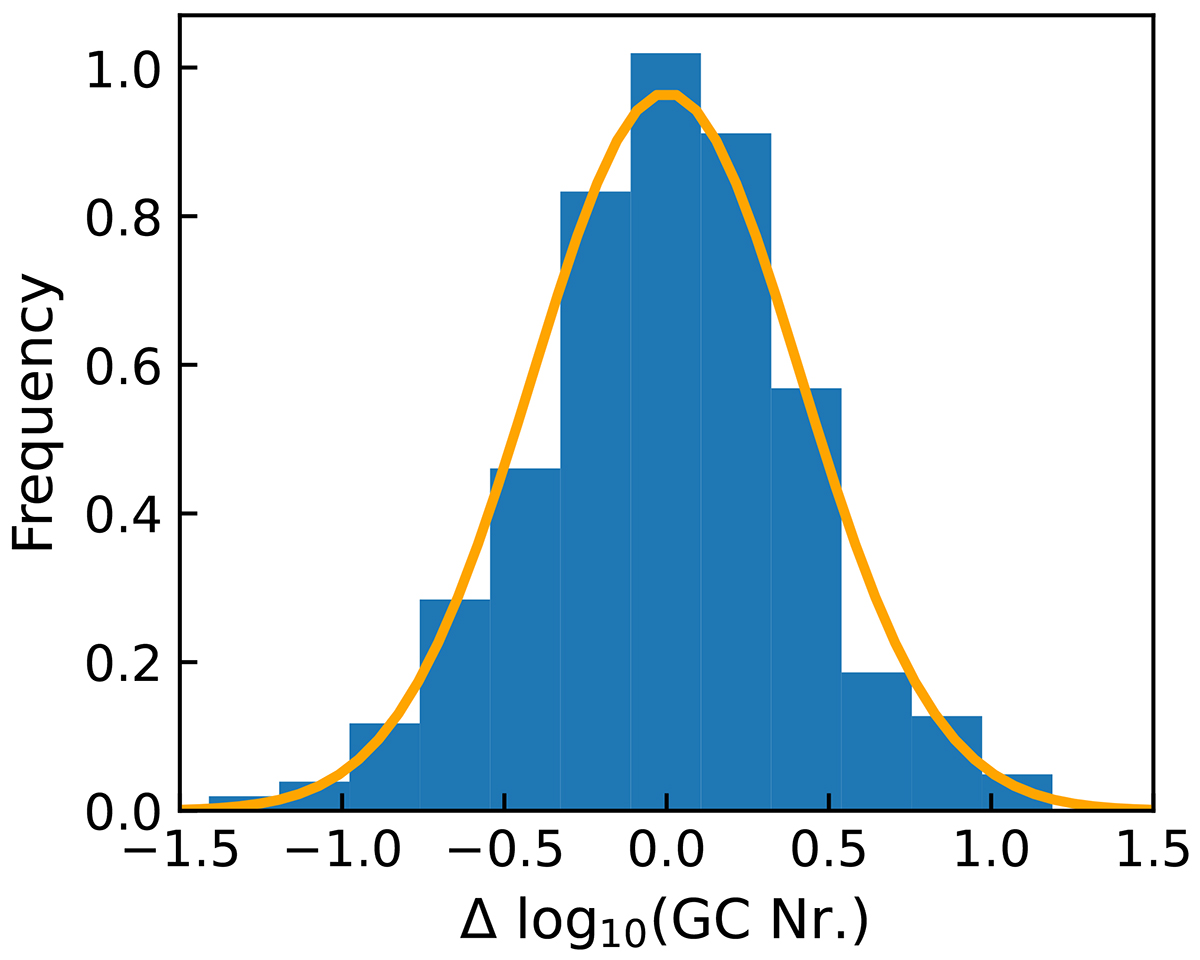
Distribution of the difference between log of the measured GC number in a given galaxy and their expected mean log(GC) number from the fitted relation (see orange fit in Fig. 3). The distribution is log normal with a mean of 0 and a standard deviation of σ = 0.41.
Current usage metrics show cumulative count of Article Views (full-text article views including HTML views, PDF and ePub downloads, according to the available data) and Abstracts Views on Vision4Press platform.
Data correspond to usage on the plateform after 2015. The current usage metrics is available 48-96 hours after online publication and is updated daily on week days.
Initial download of the metrics may take a while.