Open Access
Fig. 15.
Download original image
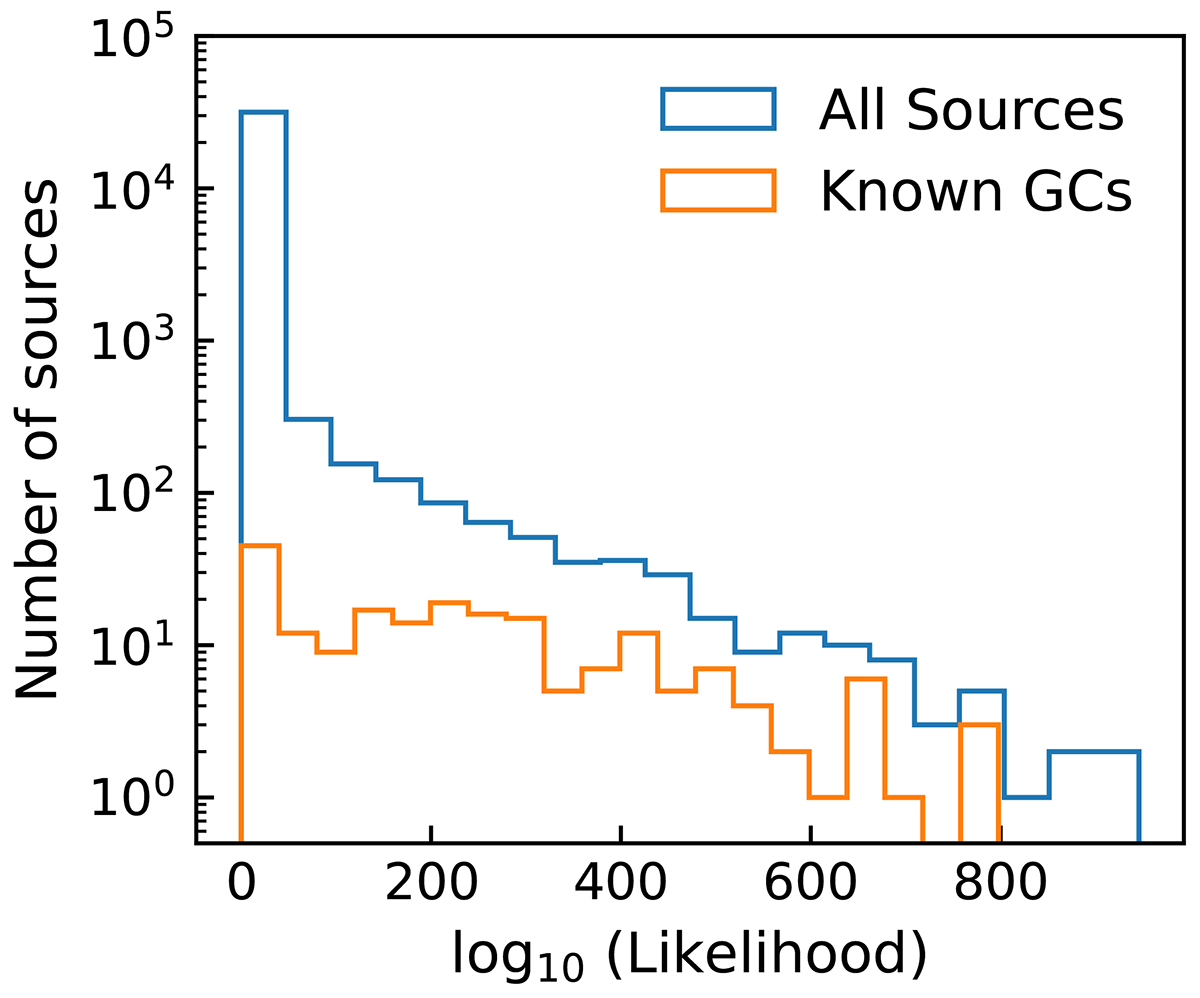
Non-normalised distribution of log-likelihoods of extracted sources: known GCs (orange) and all sources (blue). The vast majority of the source catalogue falls in the smallest bin of probability, which includes all log-likelihoods below 40 in the units of this figure.
Current usage metrics show cumulative count of Article Views (full-text article views including HTML views, PDF and ePub downloads, according to the available data) and Abstracts Views on Vision4Press platform.
Data correspond to usage on the plateform after 2015. The current usage metrics is available 48-96 hours after online publication and is updated daily on week days.
Initial download of the metrics may take a while.