Fig. 10.
Download original image
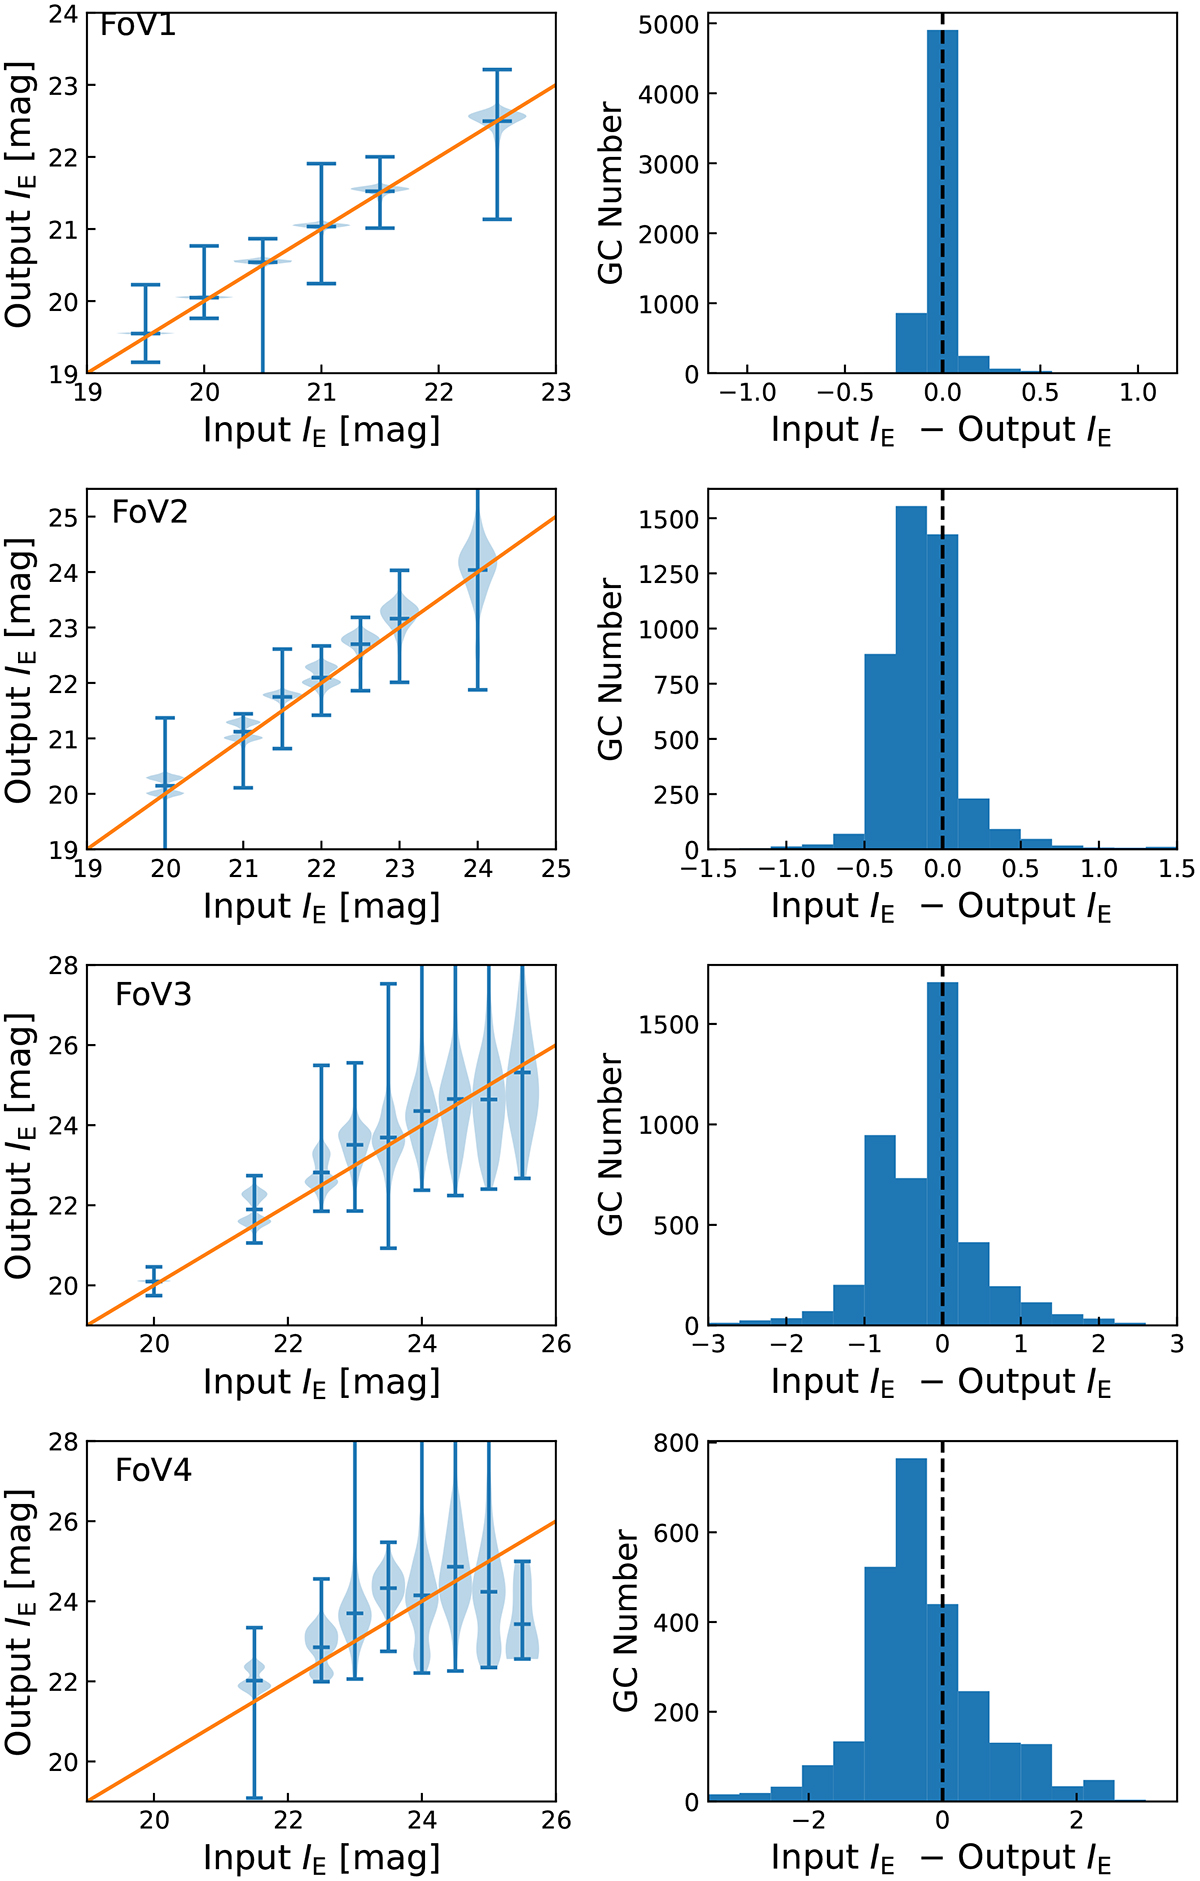
Comparison of magnitudes of simulated GCs. Left column: Comparison of input and output IE magnitudes of the simulated GCs. The distributions of measured magnitudes from the Euclid photometry pipeline are plotted against the input values, with the mean and the extremes marked with horizontal bars. From top to bottom we show the results for simulated FoV 1, 2, 3, and 4, which correspond to increasing galaxy distance. The solid line marks the 1:1 relation. Right column: Histograms of the differences between the input and output IE magnitudes for the GCs for the same four FoV.
Current usage metrics show cumulative count of Article Views (full-text article views including HTML views, PDF and ePub downloads, according to the available data) and Abstracts Views on Vision4Press platform.
Data correspond to usage on the plateform after 2015. The current usage metrics is available 48-96 hours after online publication and is updated daily on week days.
Initial download of the metrics may take a while.