Fig. 9.
Download original image
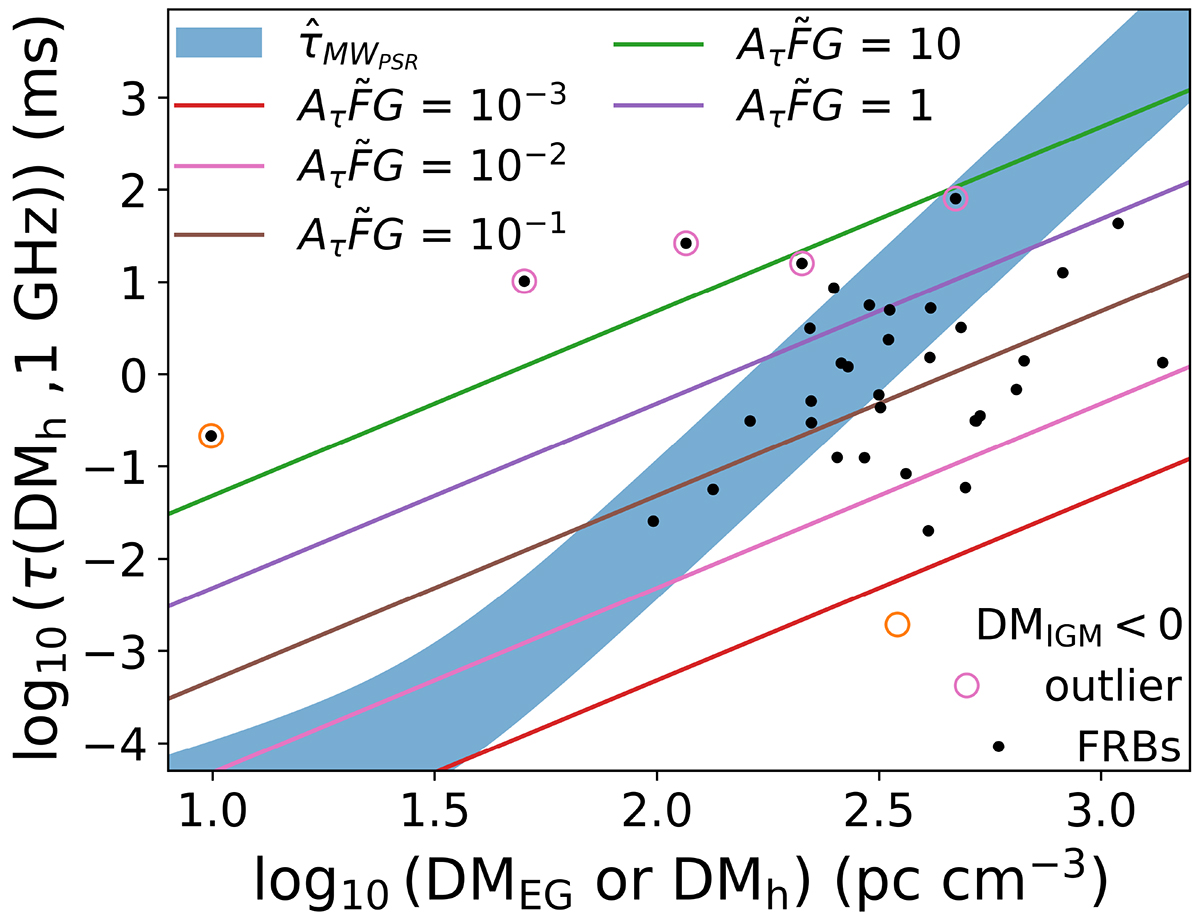
Scattering time vs. DMEG or DMh. The x-axis is the DMEG from Eq. (12) in the log scale for the FRB samples (black dots), and it shows DMh for the empirical relation based on Galactic pulsars (shaded blue region) and the ![]() models (solid colored lines). The y-axis is the scattering time at the rest-frame frequency of 1 GHz in the log scale. The black points are the 30 FRBs in our work. The pink circles are the
models (solid colored lines). The y-axis is the scattering time at the rest-frame frequency of 1 GHz in the log scale. The black points are the 30 FRBs in our work. The pink circles are the ![]() outliers in our FRB samples. The orange circle is one of our FRB samples, which is DMIGM < 0 pc cm−3. The colored lines are the
outliers in our FRB samples. The orange circle is one of our FRB samples, which is DMIGM < 0 pc cm−3. The colored lines are the ![]() models from Eq. (3) with DMh = [20, 1600] pc cm−3. The blue area is the empirical relation derived from Galactic pulsars described in Eq. (13), which includes the geometrical scaling factor for the FRB samples.
models from Eq. (3) with DMh = [20, 1600] pc cm−3. The blue area is the empirical relation derived from Galactic pulsars described in Eq. (13), which includes the geometrical scaling factor for the FRB samples.
Current usage metrics show cumulative count of Article Views (full-text article views including HTML views, PDF and ePub downloads, according to the available data) and Abstracts Views on Vision4Press platform.
Data correspond to usage on the plateform after 2015. The current usage metrics is available 48-96 hours after online publication and is updated daily on week days.
Initial download of the metrics may take a while.