Fig. 7.
Download original image
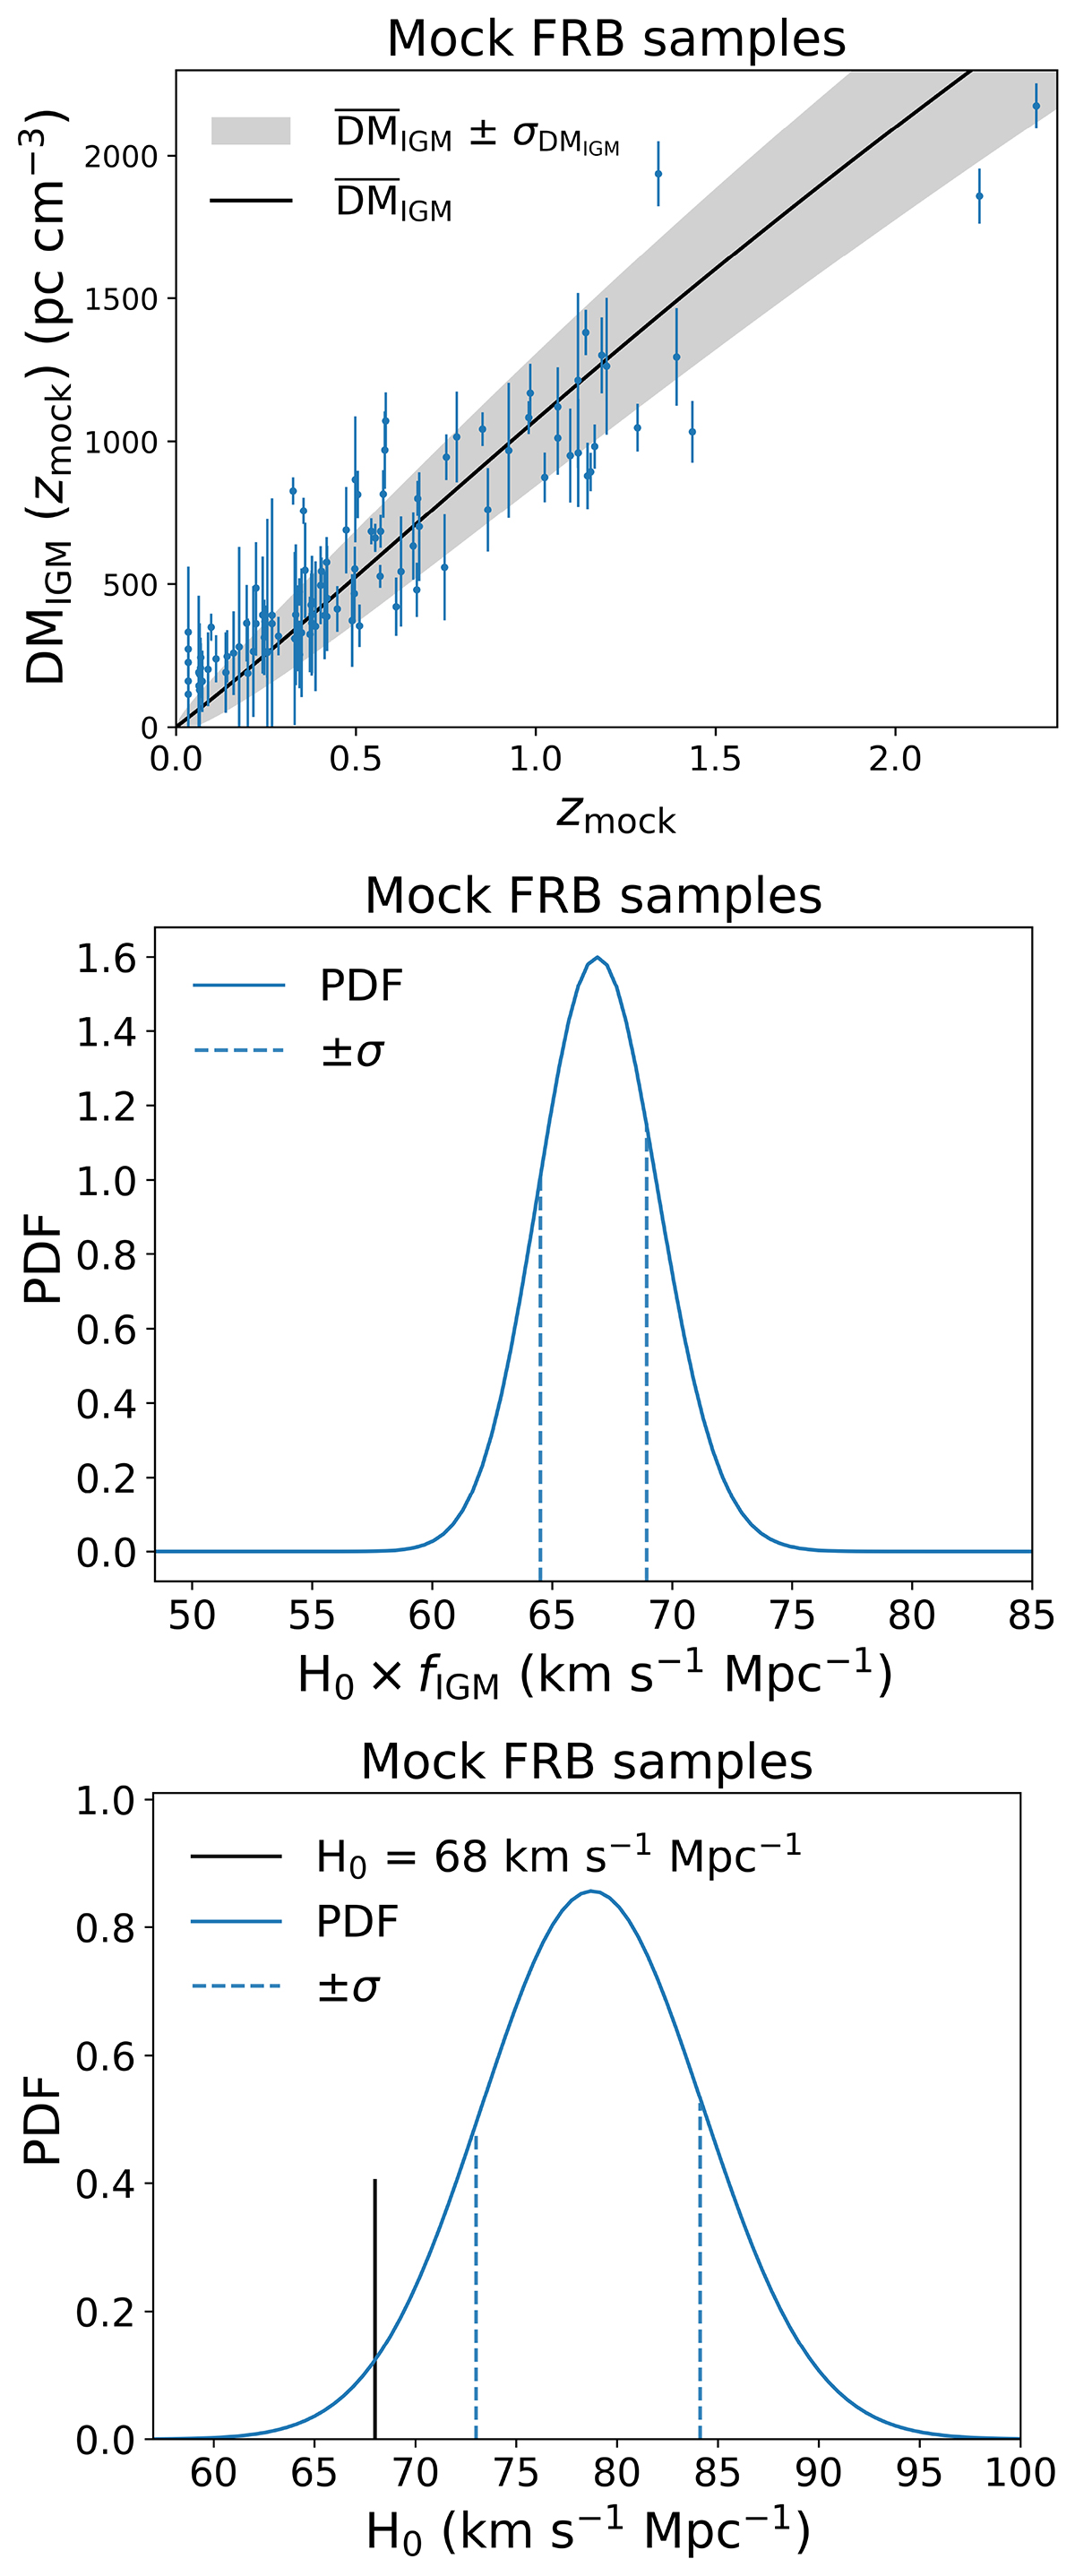
Simulation results using the previous method with mock FRB samples. Top panel: DMIGM, mock as a function of zmock. The blue dots with error bars show 100 mock FRB data, where DMIGM, mock is calculated by the previous method, assuming DMh = 50 pc cm−3. We fit Eq. (9) to the mock FRB data with a free parameter of H0. The best-fit function is shown by the solid black line, where H![]() km s−1 Mpc−1. The gray shaded region indicates the line-of-sight fluctuation of DMIGM described by Eq. (8). Middle panel: Same as the top panel of Fig. 6, but using the previous method, assuming DMh = 50 pc cm−3. Bottom panel: Same as the bottom panel of Fig. 6, but using the previous method, assuming DMh = 50 pc cm−3.
km s−1 Mpc−1. The gray shaded region indicates the line-of-sight fluctuation of DMIGM described by Eq. (8). Middle panel: Same as the top panel of Fig. 6, but using the previous method, assuming DMh = 50 pc cm−3. Bottom panel: Same as the bottom panel of Fig. 6, but using the previous method, assuming DMh = 50 pc cm−3.
Current usage metrics show cumulative count of Article Views (full-text article views including HTML views, PDF and ePub downloads, according to the available data) and Abstracts Views on Vision4Press platform.
Data correspond to usage on the plateform after 2015. The current usage metrics is available 48-96 hours after online publication and is updated daily on week days.
Initial download of the metrics may take a while.