Fig. 6.
Download original image
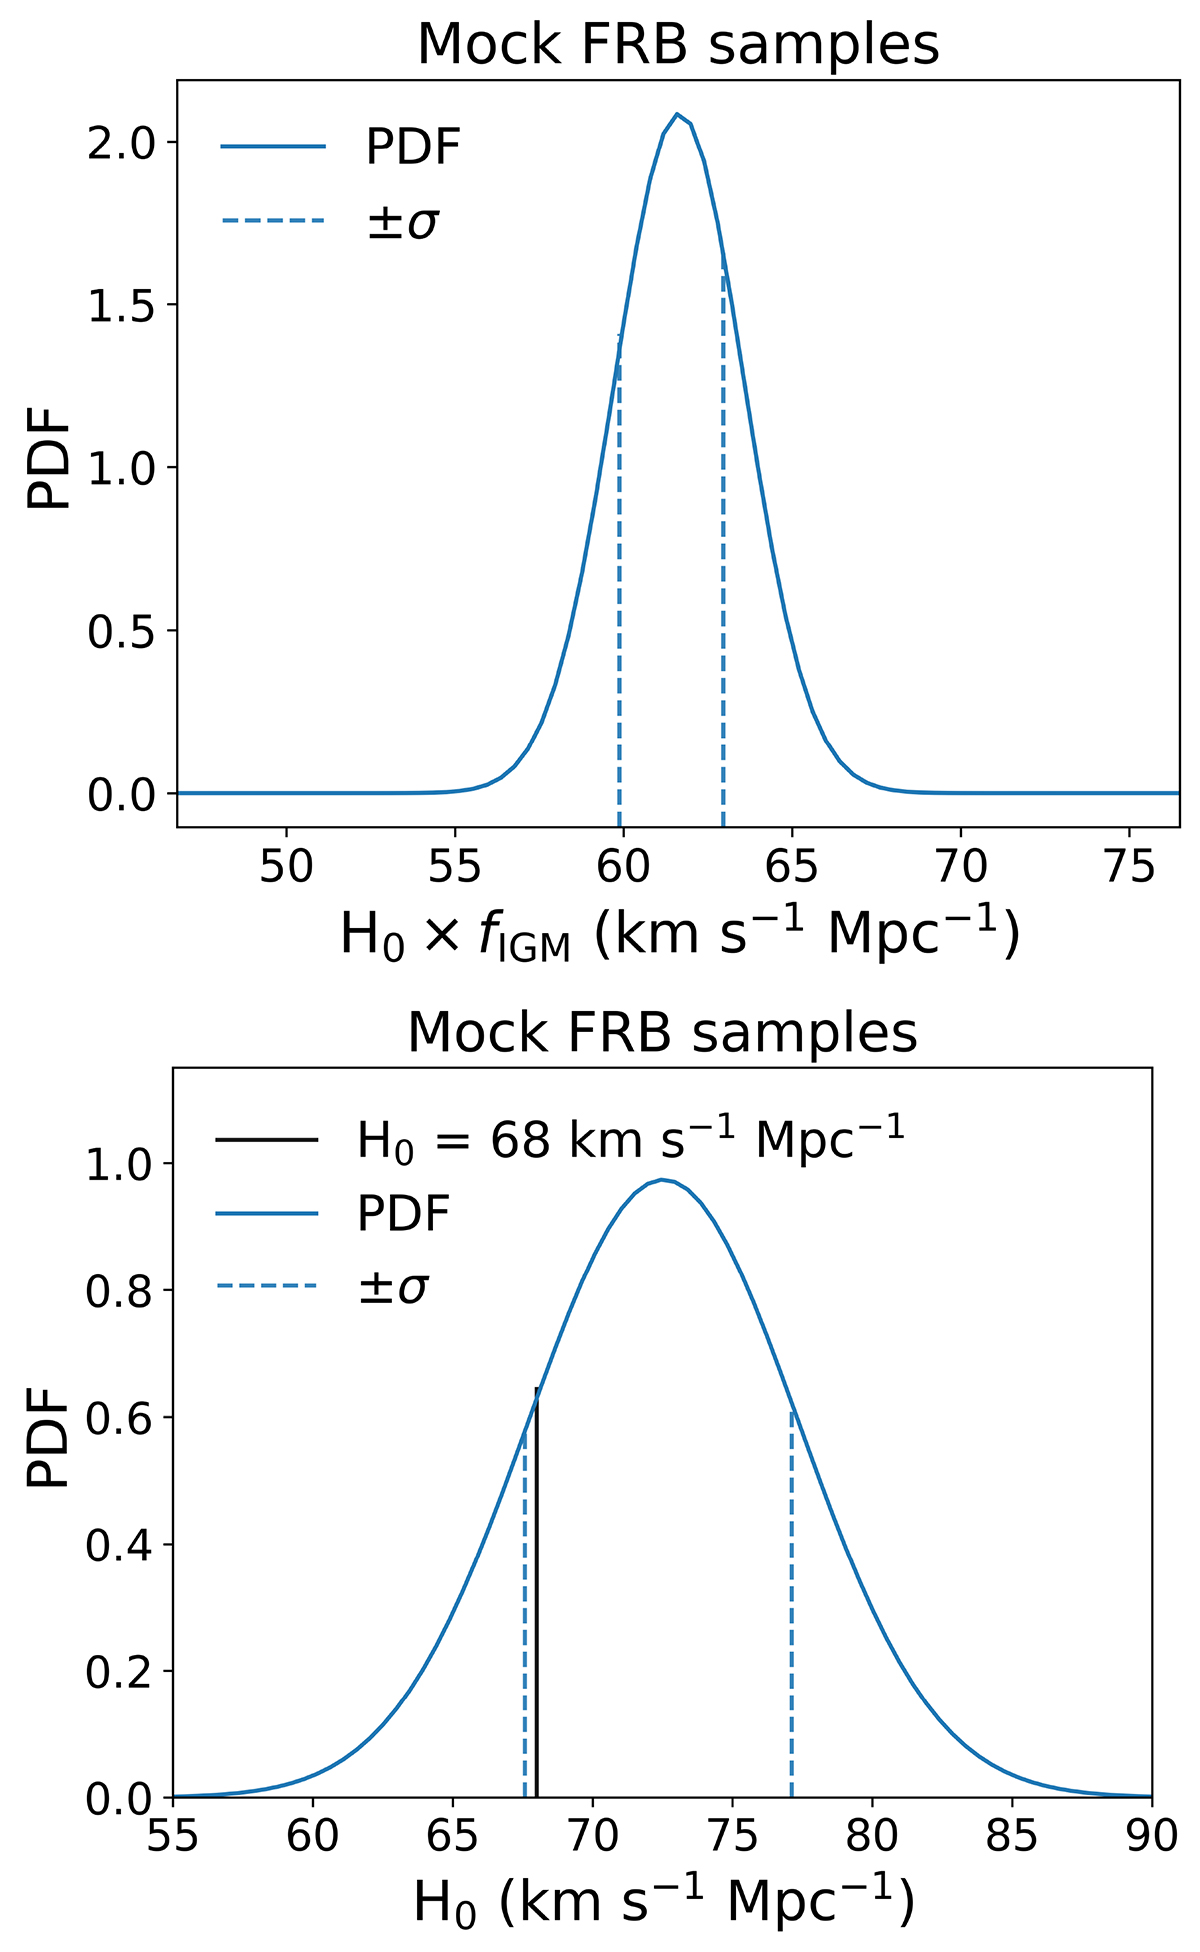
Simulation results using our method with mock FRB samples. Top panel: PDF of H0 × fIGM derived by using the 100 mock FRBs and our method with scattering (blue curve). The vertical dashed blue lines correspond to 84.2 and 15.8 percentiles (±σ) of the PDF. Bottom panel: PDF of H0 by changing the scale from H0 × fIGM (top panel) to H0. To generate the mock data, we assumed H0 = 68.0 km s−1 Mpc−1, which is shown by the solid vertical black line. The vertical dashed blue lines are the positive and negative standard deviations of H0 after taking the fIGM error into account, where the fIGM error is ±0.05 (Cordes et al. 2022).
Current usage metrics show cumulative count of Article Views (full-text article views including HTML views, PDF and ePub downloads, according to the available data) and Abstracts Views on Vision4Press platform.
Data correspond to usage on the plateform after 2015. The current usage metrics is available 48-96 hours after online publication and is updated daily on week days.
Initial download of the metrics may take a while.