Fig. 5.
Download original image
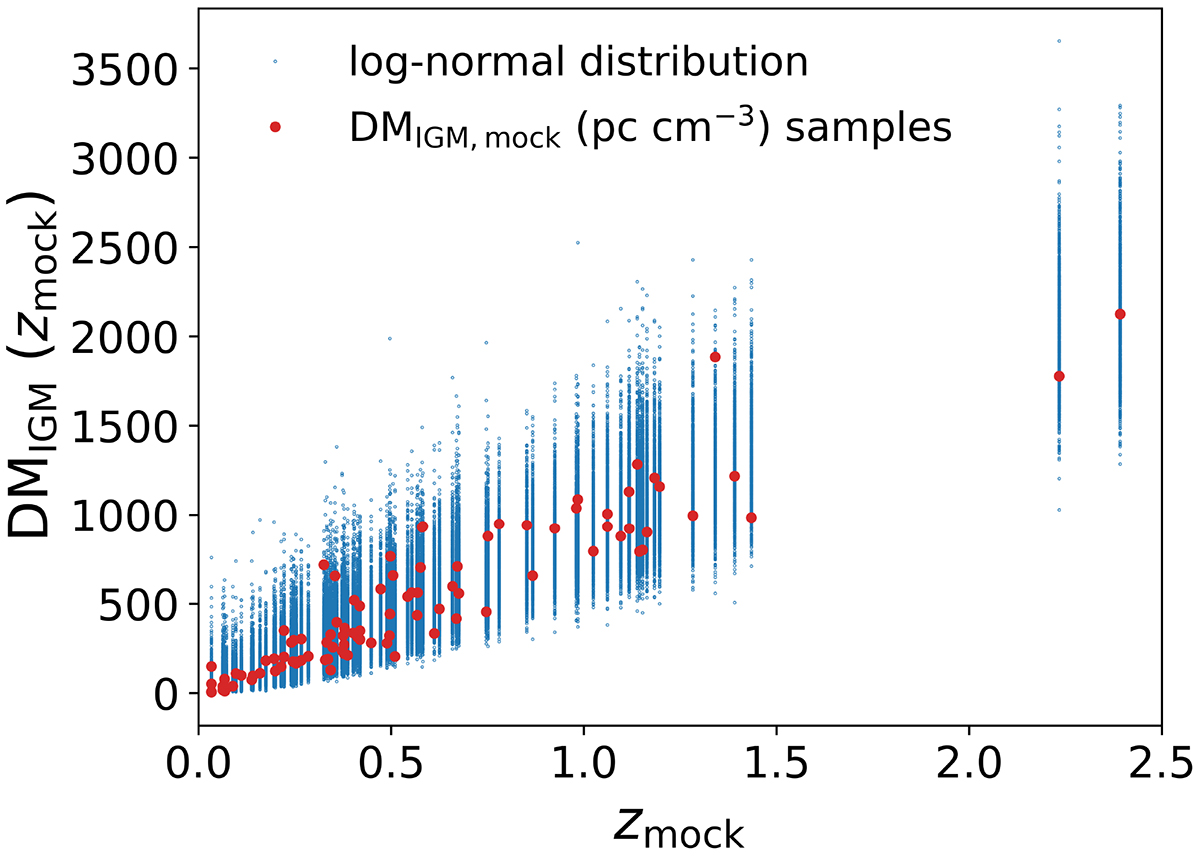
DMIGM, mock as a function of zmock. The red dots represent DMIGM, mock generated by using Eq. (8) at each zmock, taking the line-of-sight fluctuation of DMIGM into account. For a given zmock, we randomly selected one mock data point (red dot) from the blue dots. We iterated this process 100 times at the different zmock, generating 100 mock FRB data.
Current usage metrics show cumulative count of Article Views (full-text article views including HTML views, PDF and ePub downloads, according to the available data) and Abstracts Views on Vision4Press platform.
Data correspond to usage on the plateform after 2015. The current usage metrics is available 48-96 hours after online publication and is updated daily on week days.
Initial download of the metrics may take a while.