Fig. 3.
Download original image
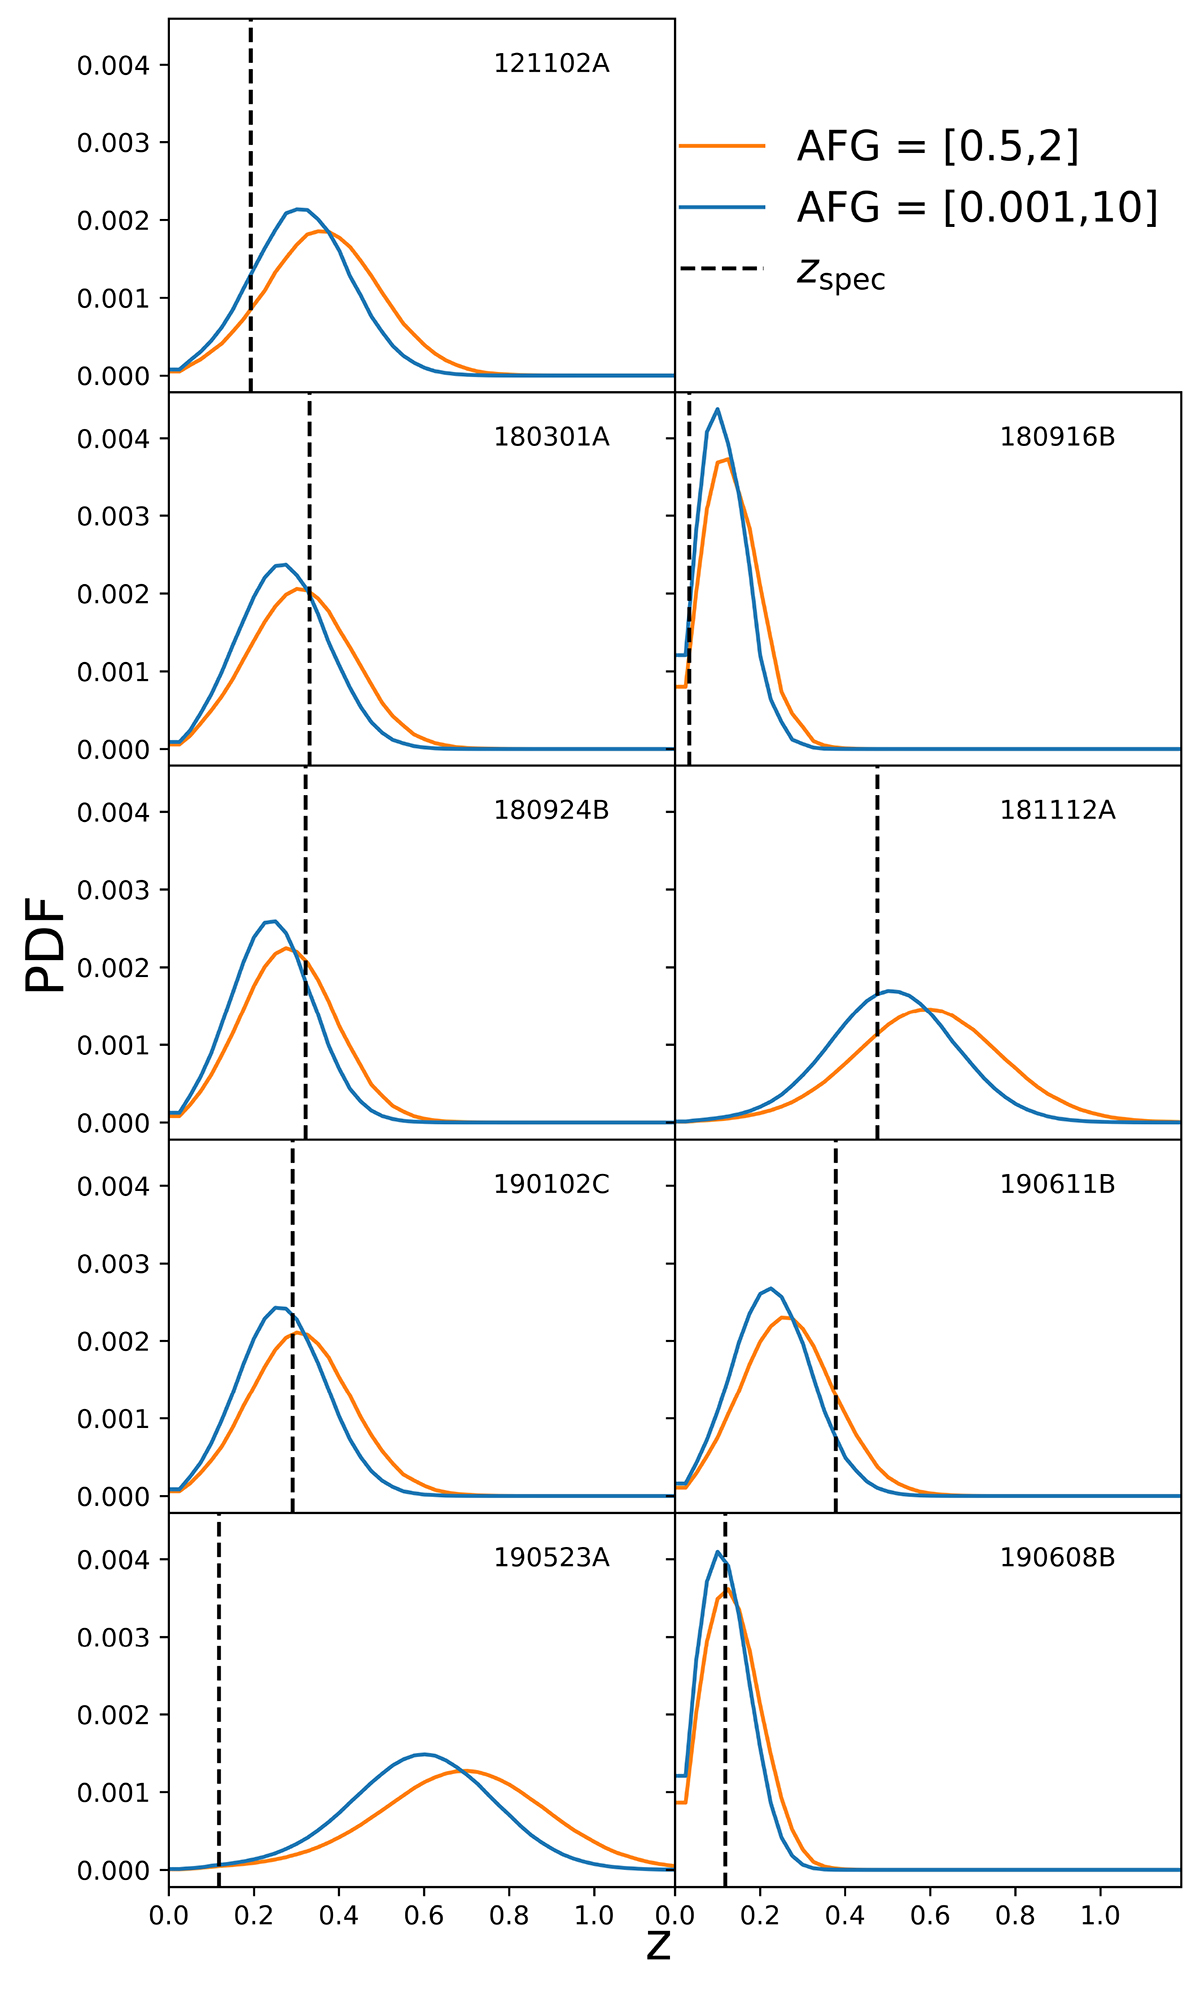
Nine examples representing the PDFs of redshift (z). These were randomly selected from our FRB samples (see Sect. 4 and Table 1 for details). H0 = 74.3 km s−1 Mpc−1 and DMh = [20, 1600] pc cm−3 were adopted. In each panel, we present PDFs based on two different ranges of ![]() : [0.5, 2] (orange line) and [0.001, 10] (blue line)
: [0.5, 2] (orange line) and [0.001, 10] (blue line) ![]() . The vertical dashed black line shows the observed redshift (zspec) in each panel.
. The vertical dashed black line shows the observed redshift (zspec) in each panel.
Current usage metrics show cumulative count of Article Views (full-text article views including HTML views, PDF and ePub downloads, according to the available data) and Abstracts Views on Vision4Press platform.
Data correspond to usage on the plateform after 2015. The current usage metrics is available 48-96 hours after online publication and is updated daily on week days.
Initial download of the metrics may take a while.