Fig. 2.
Download original image
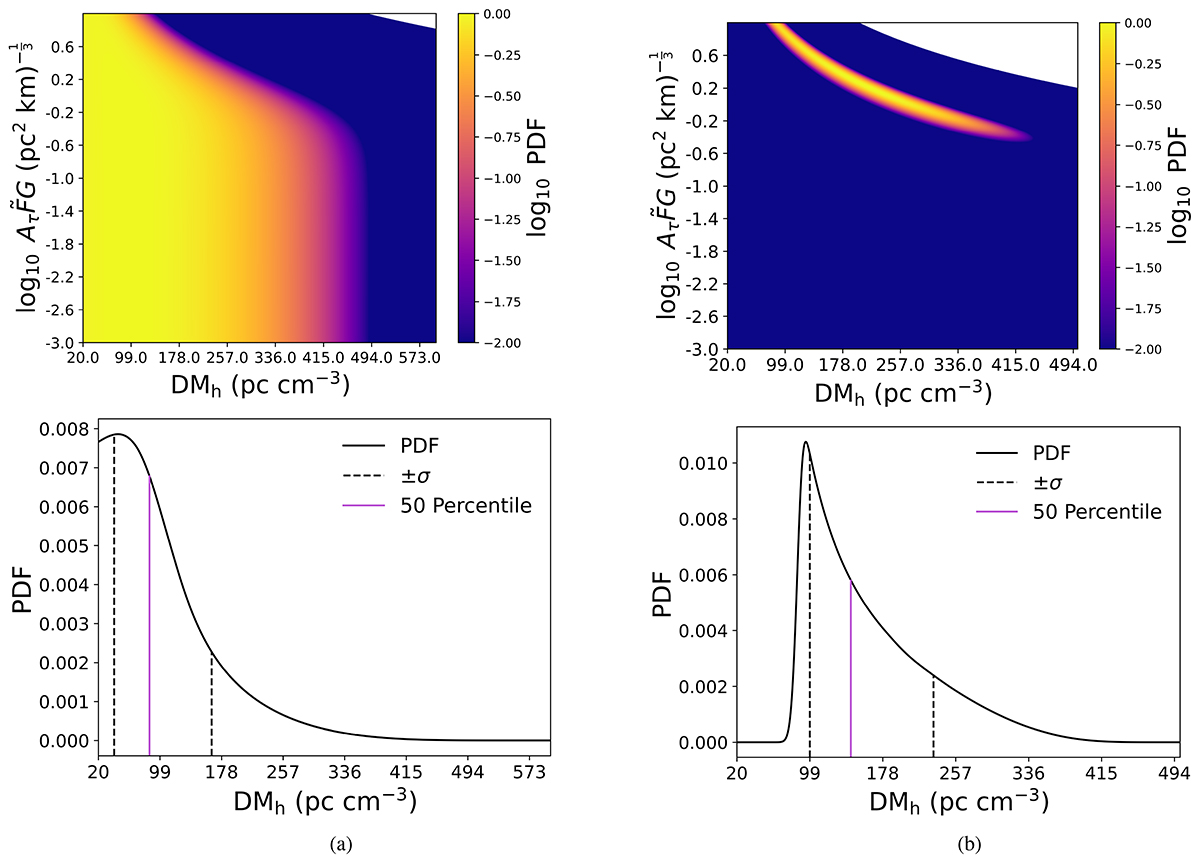
Two examples of the PDF in our observational samples. Top left panel: Three-dimensional image of fDMh for FRB 20181112A (see Sect. 4 and Table 1 for details). The x-axis is the DMh parameter from 20 to 600 pc cm−3. The y-axis is the ![]() parameter from −3 to 1
parameter from −3 to 1 ![]() in log scale. For a given DMh and
in log scale. For a given DMh and ![]() , the corresponding probability density in the log scale is presented by color. Bottom left panel: Integration of the PDF over the
, the corresponding probability density in the log scale is presented by color. Bottom left panel: Integration of the PDF over the ![]() parameter from 0.001 to 10
parameter from 0.001 to 10 ![]() , which provides us with the PDF of DMh. The purple line shows the 50 percentile of the PDF. The dashed black lines correspond to the 84.2 and 15.8 percentiles of the PDF (±σ). The 50 percentile is DMh = 85.6 pc cm−3, +σ = 78 pc cm−3, and −σ = 45.4 pc cm−3. Top right panel: Example of a 3D image of fDMh by using FRB 20191001A (see Sect. 4 and Table 1 for details). Bottom left panel: Same as the bottom left panel, but using FRB 20191001A. The 50 percentile is DMh = 143.3 pc cm−3, +σ = 89.3 pc cm−3, and −σ = 44.2 pc cm−3.
, which provides us with the PDF of DMh. The purple line shows the 50 percentile of the PDF. The dashed black lines correspond to the 84.2 and 15.8 percentiles of the PDF (±σ). The 50 percentile is DMh = 85.6 pc cm−3, +σ = 78 pc cm−3, and −σ = 45.4 pc cm−3. Top right panel: Example of a 3D image of fDMh by using FRB 20191001A (see Sect. 4 and Table 1 for details). Bottom left panel: Same as the bottom left panel, but using FRB 20191001A. The 50 percentile is DMh = 143.3 pc cm−3, +σ = 89.3 pc cm−3, and −σ = 44.2 pc cm−3.
Current usage metrics show cumulative count of Article Views (full-text article views including HTML views, PDF and ePub downloads, according to the available data) and Abstracts Views on Vision4Press platform.
Data correspond to usage on the plateform after 2015. The current usage metrics is available 48-96 hours after online publication and is updated daily on week days.
Initial download of the metrics may take a while.