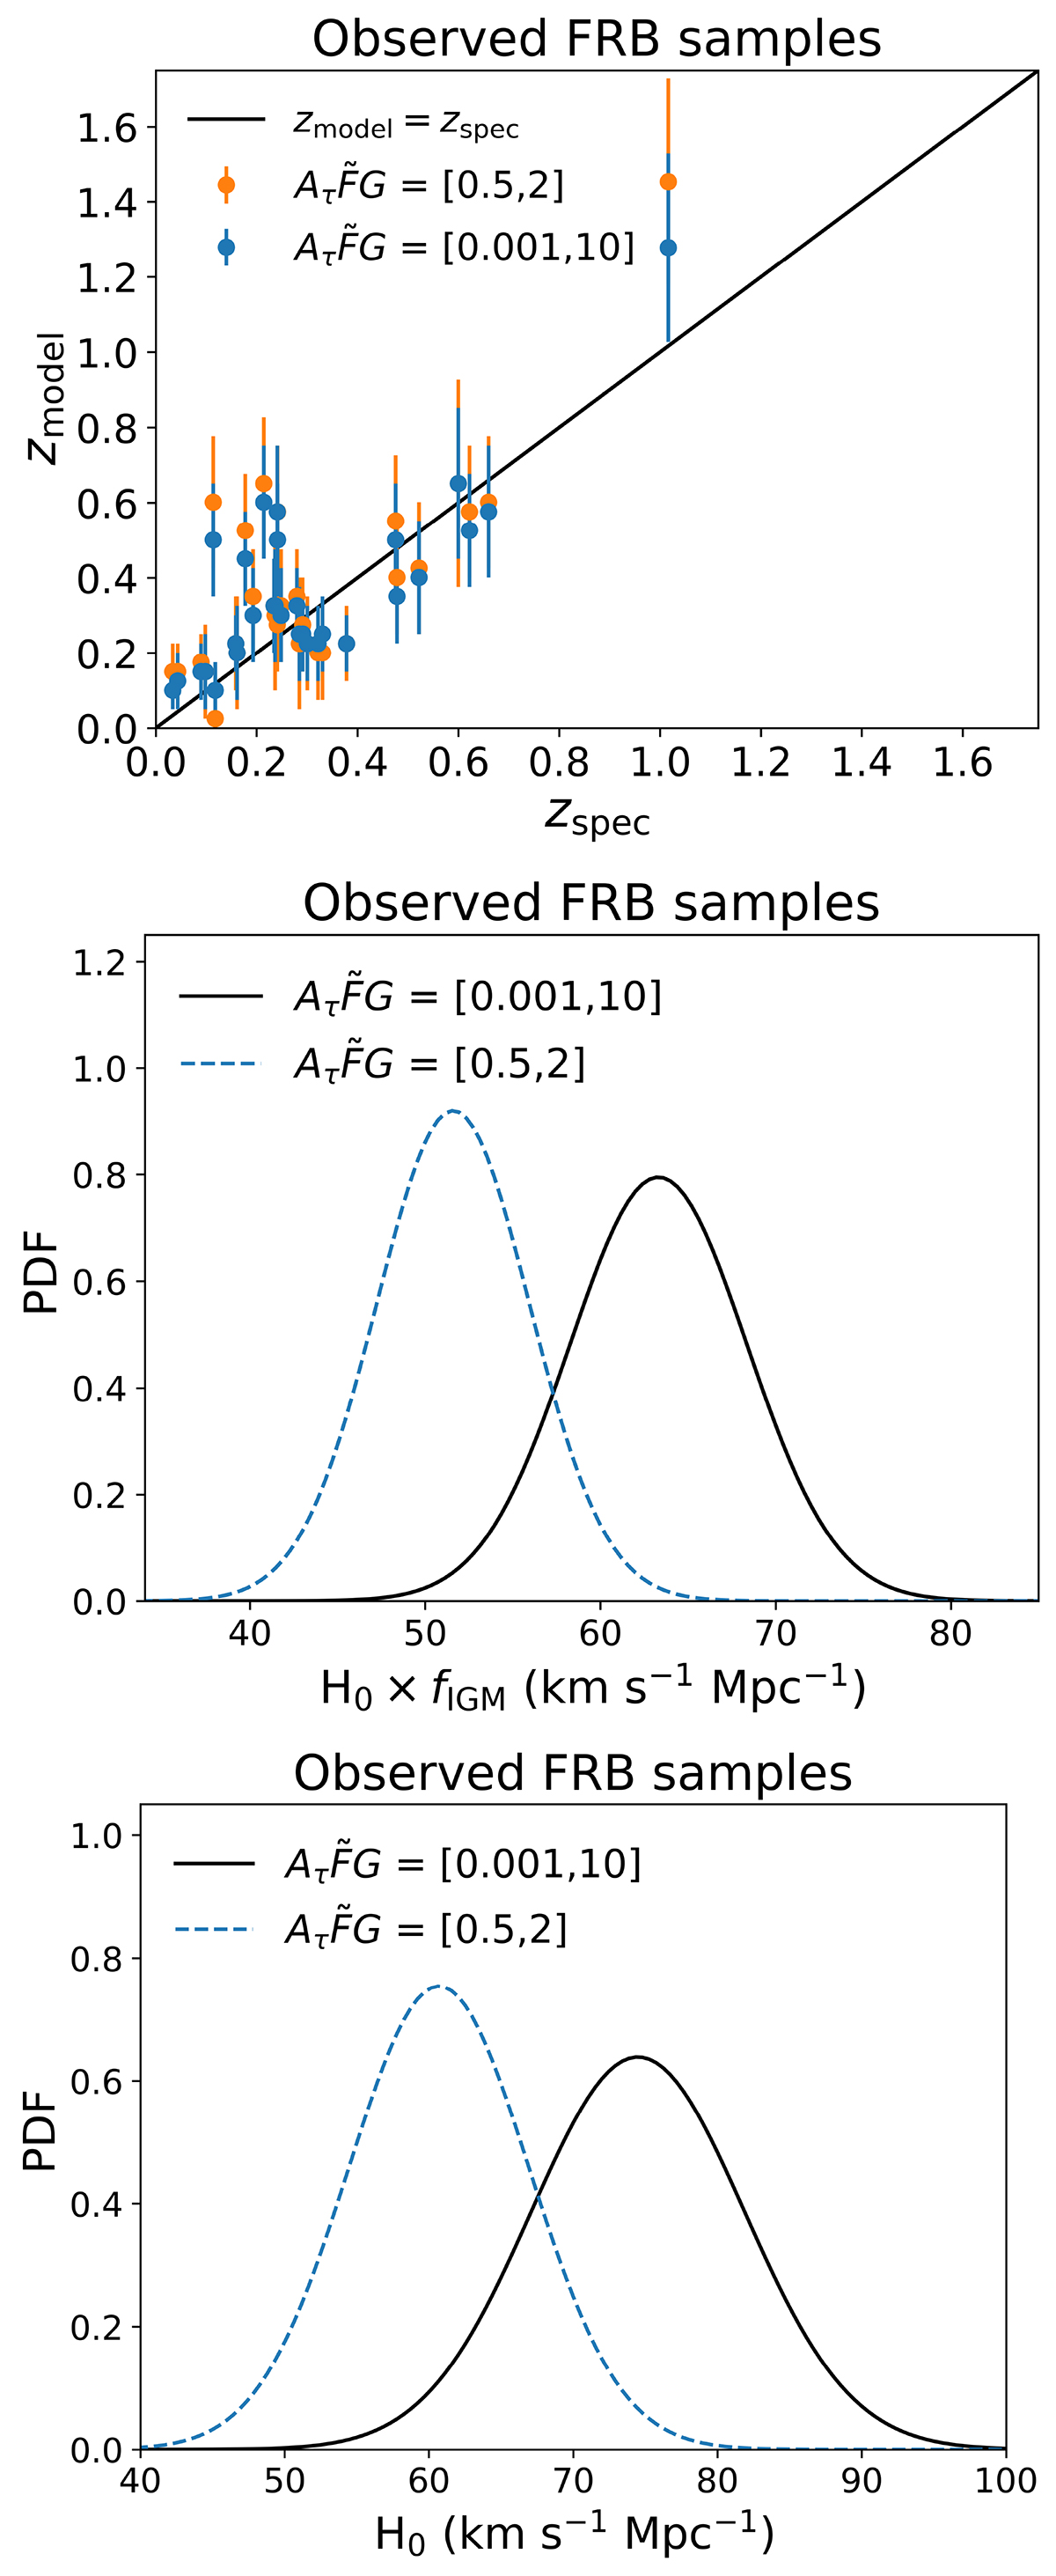
Fig. 13.
Download original image
Comparison of results across different ![]() ranges. Top panel: zmodel vs. zobs, same as Fig. 12, but with optimized fIGM × H0 values, where fIGM × H0 are
ranges. Top panel: zmodel vs. zobs, same as Fig. 12, but with optimized fIGM × H0 values, where fIGM × H0 are ![]() km s−1 Mpc−1 and
km s−1 Mpc−1 and ![]() km s−1 Mpc−1 for the narrow and wide
km s−1 Mpc−1 for the narrow and wide ![]() ranges, respectively. Middle panel: PDF of fIGM × H0 using the 30 FRB samples and our method. The solid black line corresponds to the wide
ranges, respectively. Middle panel: PDF of fIGM × H0 using the 30 FRB samples and our method. The solid black line corresponds to the wide ![]() range, and the dashed blue line corresponds to the narrow
range, and the dashed blue line corresponds to the narrow ![]() range. Bottom panel: PDF of H0 for a given fIGM = 0.85 ± 0.05 using the 30 FRB samples and our method.
range. Bottom panel: PDF of H0 for a given fIGM = 0.85 ± 0.05 using the 30 FRB samples and our method.
Current usage metrics show cumulative count of Article Views (full-text article views including HTML views, PDF and ePub downloads, according to the available data) and Abstracts Views on Vision4Press platform.
Data correspond to usage on the plateform after 2015. The current usage metrics is available 48-96 hours after online publication and is updated daily on week days.
Initial download of the metrics may take a while.