Fig. 1.
Download original image
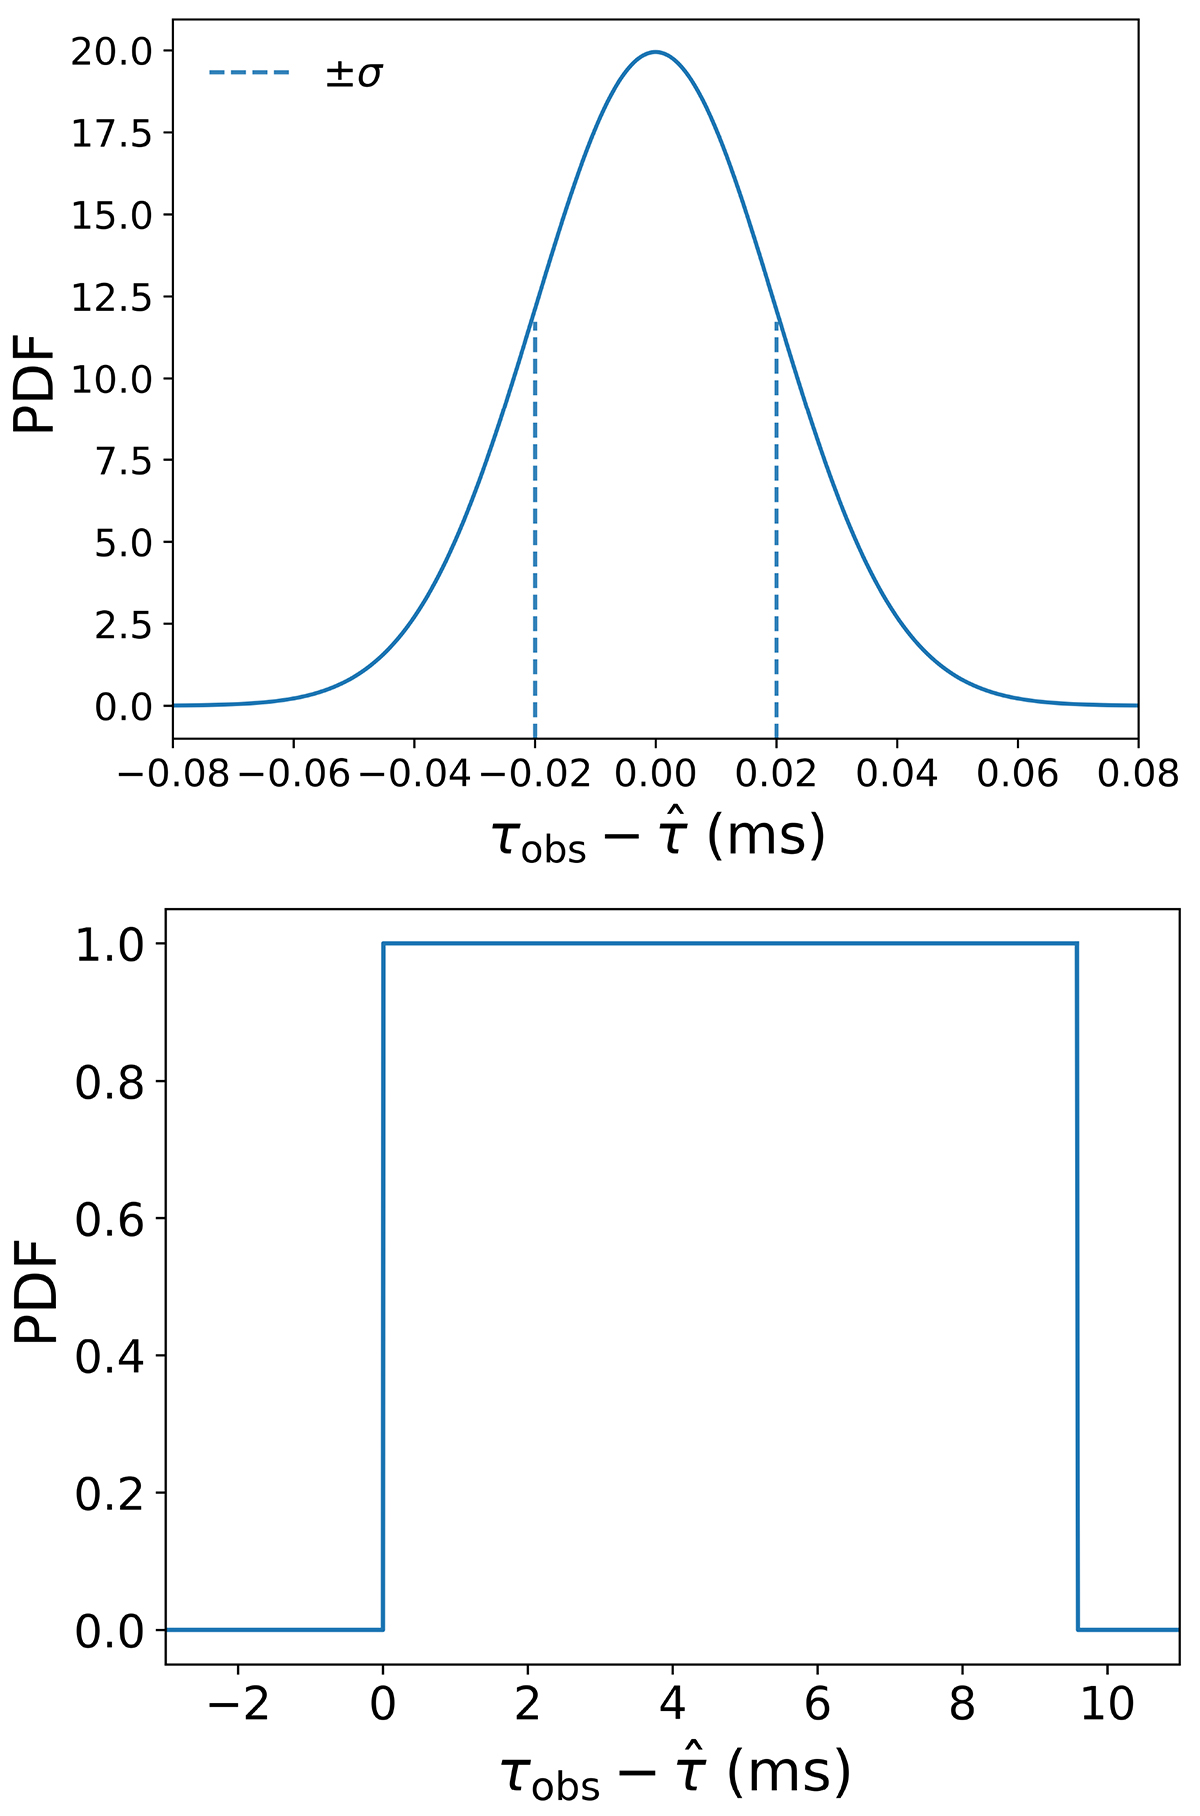
PDF of ![]() . Top panel: Case for FRB 20220509G as an example (see Sect. 4 for details), assuming log
. Top panel: Case for FRB 20220509G as an example (see Sect. 4 for details), assuming log ![]() . The peak of the PDF is at
. The peak of the PDF is at ![]() , and the standard deviation is στ = 0.02 ms (see also Table 1). Bottom panel: FRBs with an upper limit of the scattering were given a flat PDF. We take FRB 20121102A as an example with the observed scattering of τobs < 9.6 ms (Sect. 4 and Table 1), assuming log
, and the standard deviation is στ = 0.02 ms (see also Table 1). Bottom panel: FRBs with an upper limit of the scattering were given a flat PDF. We take FRB 20121102A as an example with the observed scattering of τobs < 9.6 ms (Sect. 4 and Table 1), assuming log ![]() . When
. When ![]() is lower than 0 or greater than τobs, the probability is 0. When
is lower than 0 or greater than τobs, the probability is 0. When ![]() falls between 0 and τobs, the probability is nonzero and flat. We note that the vertical axes in both panels indicate relative quantities of the probability density.
falls between 0 and τobs, the probability is nonzero and flat. We note that the vertical axes in both panels indicate relative quantities of the probability density.
Current usage metrics show cumulative count of Article Views (full-text article views including HTML views, PDF and ePub downloads, according to the available data) and Abstracts Views on Vision4Press platform.
Data correspond to usage on the plateform after 2015. The current usage metrics is available 48-96 hours after online publication and is updated daily on week days.
Initial download of the metrics may take a while.