Fig. 4
Download original image
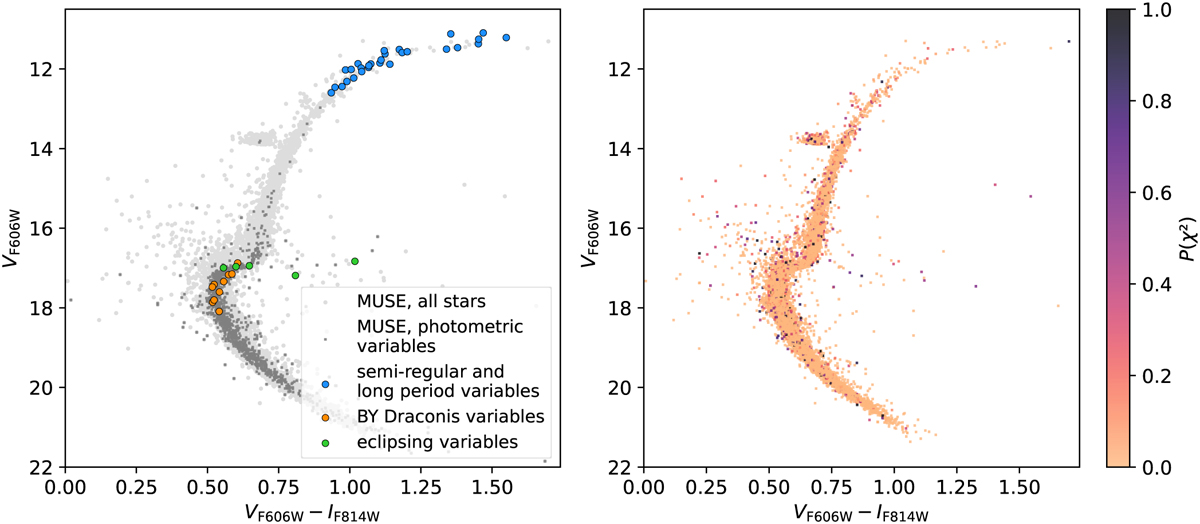
Color–magnitude diagram of the stars contained in the filtered MUSE data set, generated using ACS HST photometry. Left: long-period and semi-regular pulsating variables, BY Draconis-type variables, and eclipsing binaries cross-matched from the catalog of known variable stars in GCs by Clement et al. (2001) are highlighted in blue, orange and green, respectively. Stars discarded from the data set because of photometric variability in the MUSE data are indicated in dark grey. Right: all stars in the MUSE filtered data set color-coded according to their variability probability.
Current usage metrics show cumulative count of Article Views (full-text article views including HTML views, PDF and ePub downloads, according to the available data) and Abstracts Views on Vision4Press platform.
Data correspond to usage on the plateform after 2015. The current usage metrics is available 48-96 hours after online publication and is updated daily on week days.
Initial download of the metrics may take a while.