Fig. A.1
Download original image
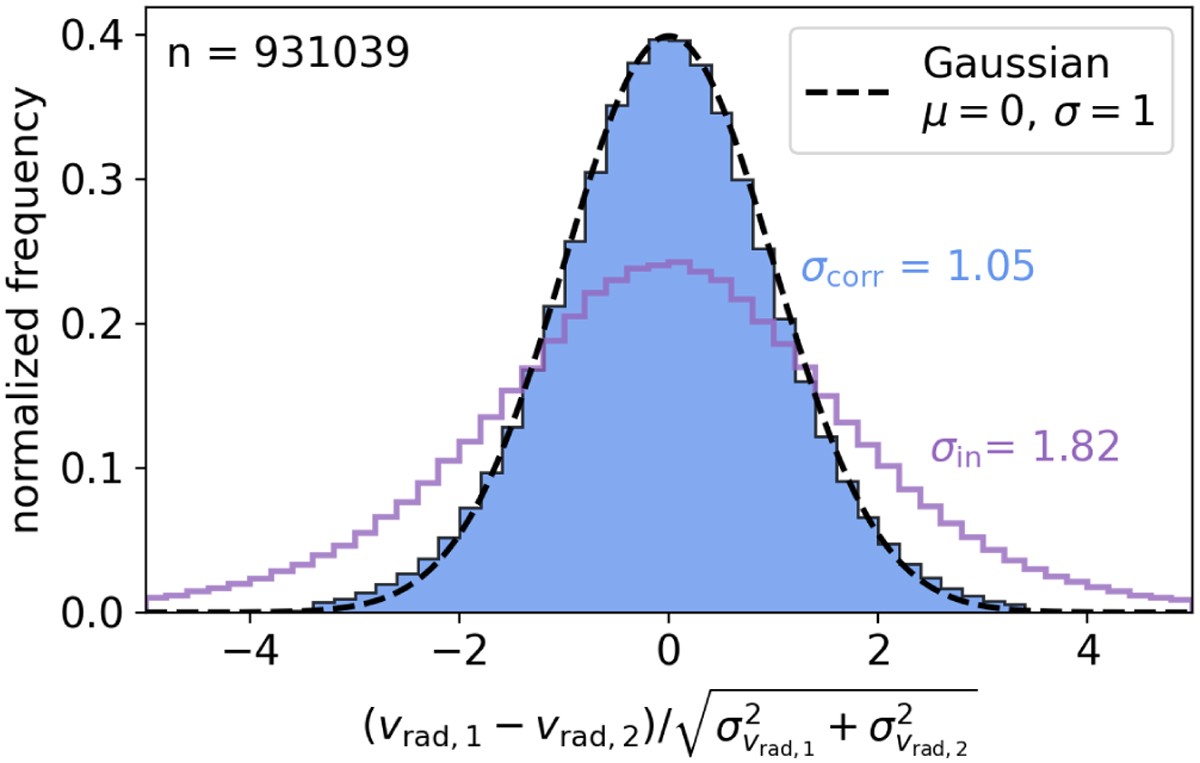
RV differences normalized by their uncertainties (added in quadrature) for stars with multiple measurements. The dashed black line represents the expected standard normal distribution for correctly estimated uncertainties. The observed distribution for 931 039 velocity pairs (purple line) is wider, with a fitted standard deviation of σin = 1.82, indicating underestimated RV uncertainties. After applying S/N-dependent scaling factors to calibrate the uncertainties, the resulting distribution (blue histogram) closely matches the expected normal distribution, with a fitted standard deviation of σcorr = 1.05. These calibrated uncertainties were used for the RV variability analysis.
Current usage metrics show cumulative count of Article Views (full-text article views including HTML views, PDF and ePub downloads, according to the available data) and Abstracts Views on Vision4Press platform.
Data correspond to usage on the plateform after 2015. The current usage metrics is available 48-96 hours after online publication and is updated daily on week days.
Initial download of the metrics may take a while.