Open Access
Fig. 17
Download original image
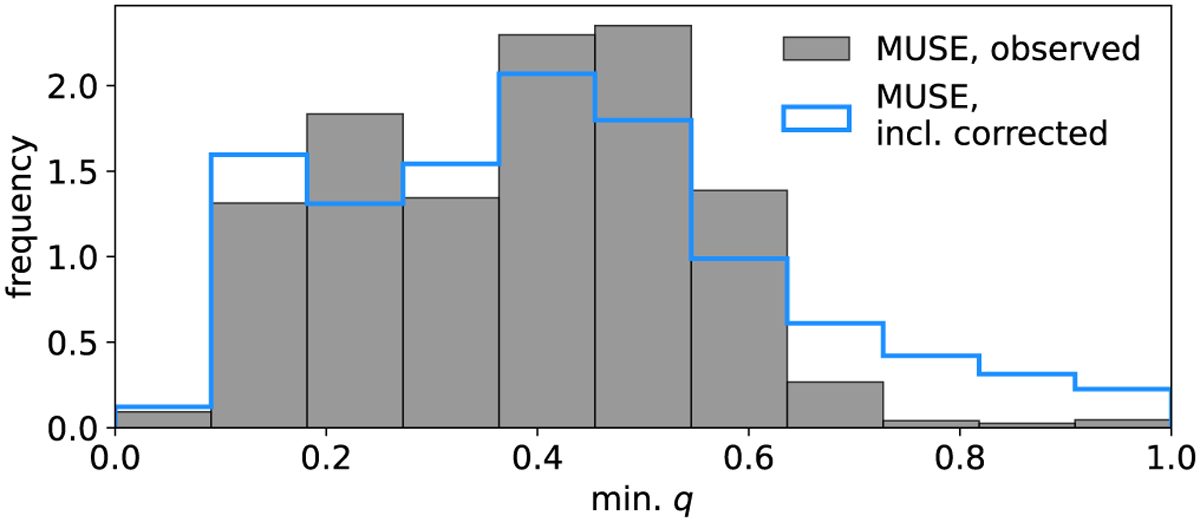
Normalized mass ratio distribution of the subset of well- constrained binaries in 47 Tuc. The gray filled histogram shows the distribution of minimum mass ratios derived from the UltraNest posterior samples. The blue line shows the same results but with a statistical correction to account for orbital inclinations.
Current usage metrics show cumulative count of Article Views (full-text article views including HTML views, PDF and ePub downloads, according to the available data) and Abstracts Views on Vision4Press platform.
Data correspond to usage on the plateform after 2015. The current usage metrics is available 48-96 hours after online publication and is updated daily on week days.
Initial download of the metrics may take a while.