Fig. 14
Download original image
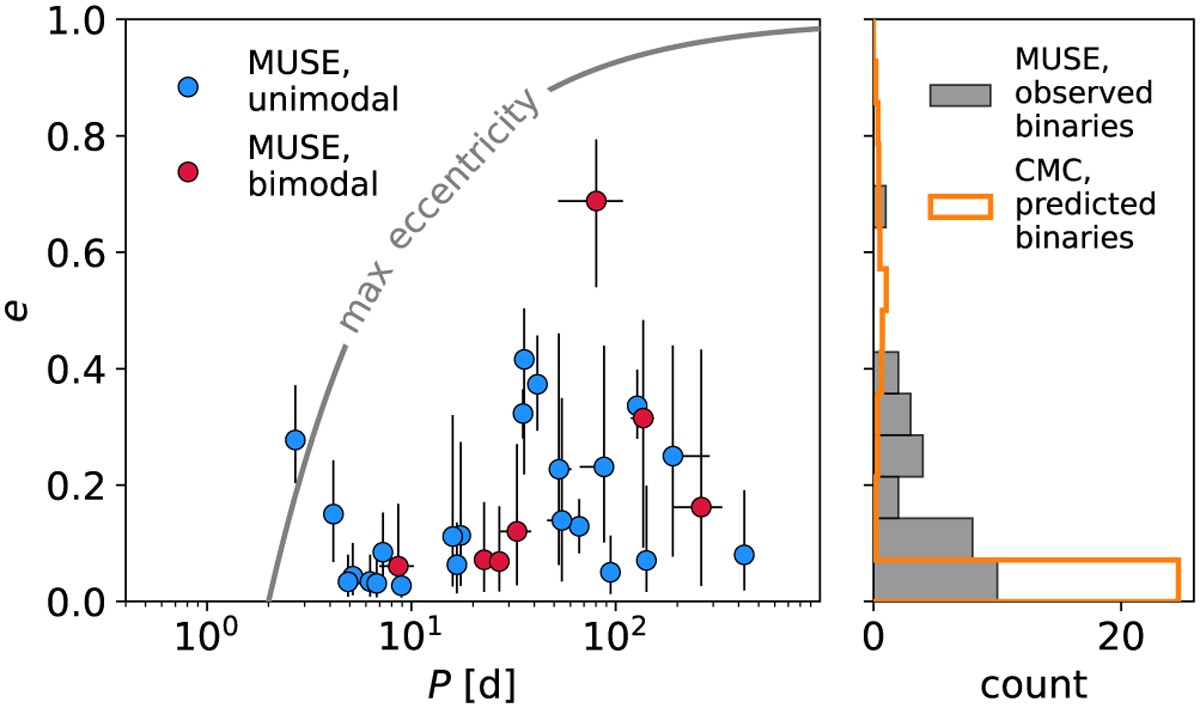
Period-eccentricity distribution of the 30 well-constrained binaries with uni- (blue) or bimodal (red) posterior period distributions. The maximum eccentricity limit as defined by Moe & Di Stefano (2017) is indicated as a solid gray line. The panel on the right-hand side shows a collapsed histogram of the eccentricity distribution for the well- constrained MUSE binaries. For comparison, the predicted eccentricity distribution of the detectable CMC binaries is plotted in orange, scaled to the number of MUSE binaries for better readability.
Current usage metrics show cumulative count of Article Views (full-text article views including HTML views, PDF and ePub downloads, according to the available data) and Abstracts Views on Vision4Press platform.
Data correspond to usage on the plateform after 2015. The current usage metrics is available 48-96 hours after online publication and is updated daily on week days.
Initial download of the metrics may take a while.