Open Access
Fig. 9
Download original image
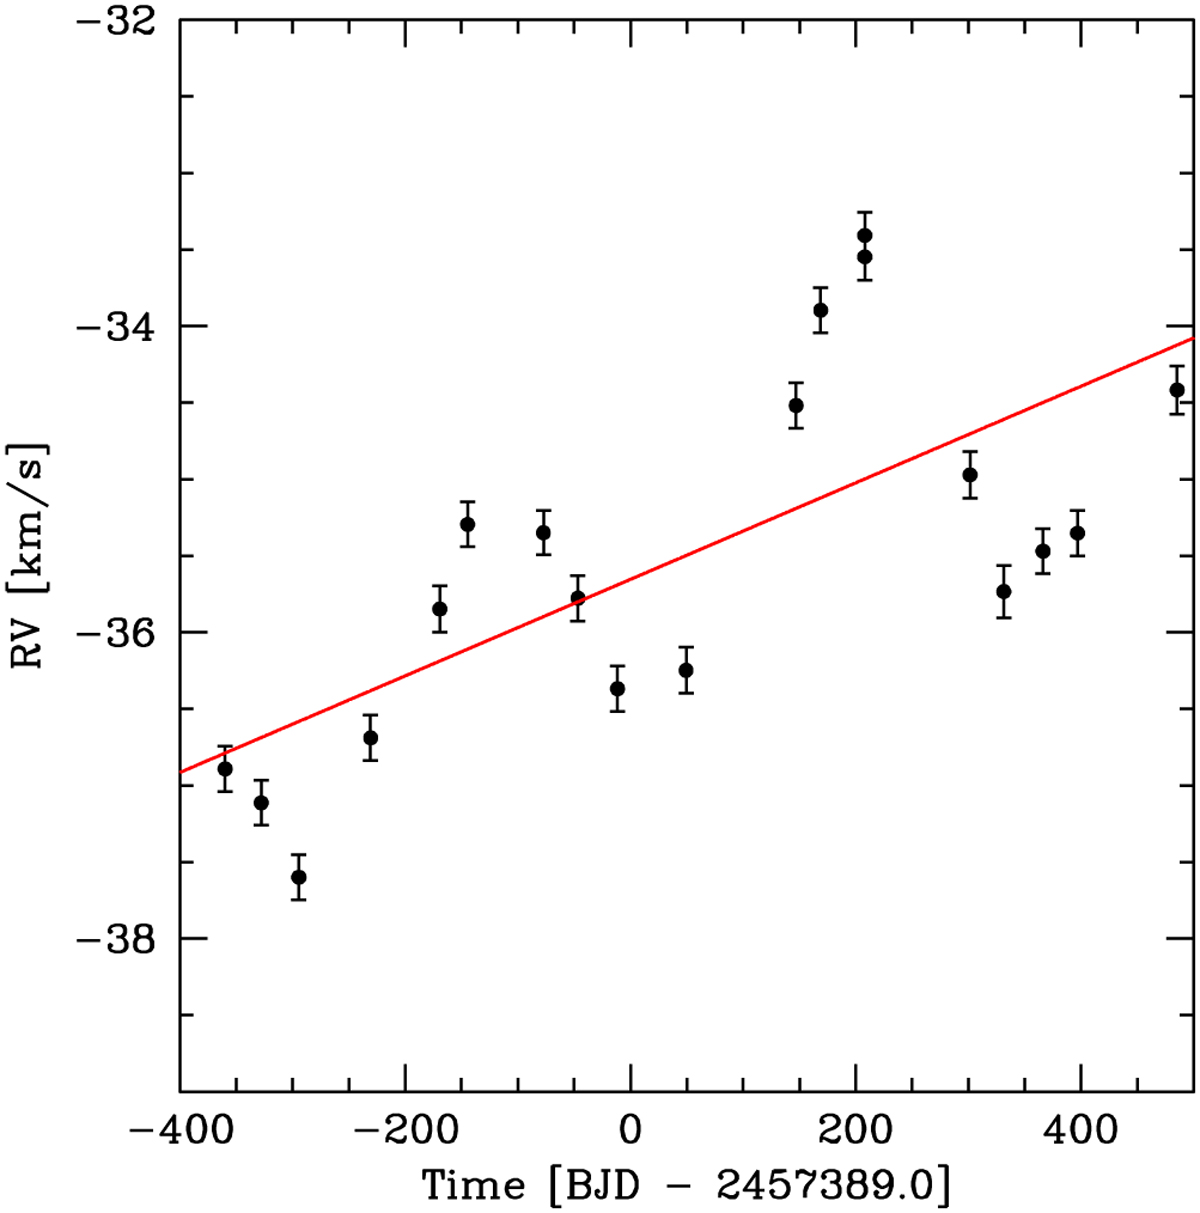
Illustration of a time series of RVs for an anonymous object (unpublished). The dots represent the observed RVs with their error bars. The red straight line shows the trend fitted by the pipeline. It corresponds to F2 = 20.42 and thus the corresponding solution is rejected.
Current usage metrics show cumulative count of Article Views (full-text article views including HTML views, PDF and ePub downloads, according to the available data) and Abstracts Views on Vision4Press platform.
Data correspond to usage on the plateform after 2015. The current usage metrics is available 48-96 hours after online publication and is updated daily on week days.
Initial download of the metrics may take a while.